Grafana est une application open source multiplateforme permettant de représenter graphiquement des données provenant de différentes sources de données telles que InfluxDB, MySQL, PostgreSQL ou Prometheus. Aujourd’hui, je montre comment installer un service Grafana sur le diskstation Synology.
Étape 1 : Préparer Synology
La première chose à faire est d’activer le login SSH sur le Diskstation. Pour cela, il faut aller dans le “Panneau de configuration” > “Terminal”.
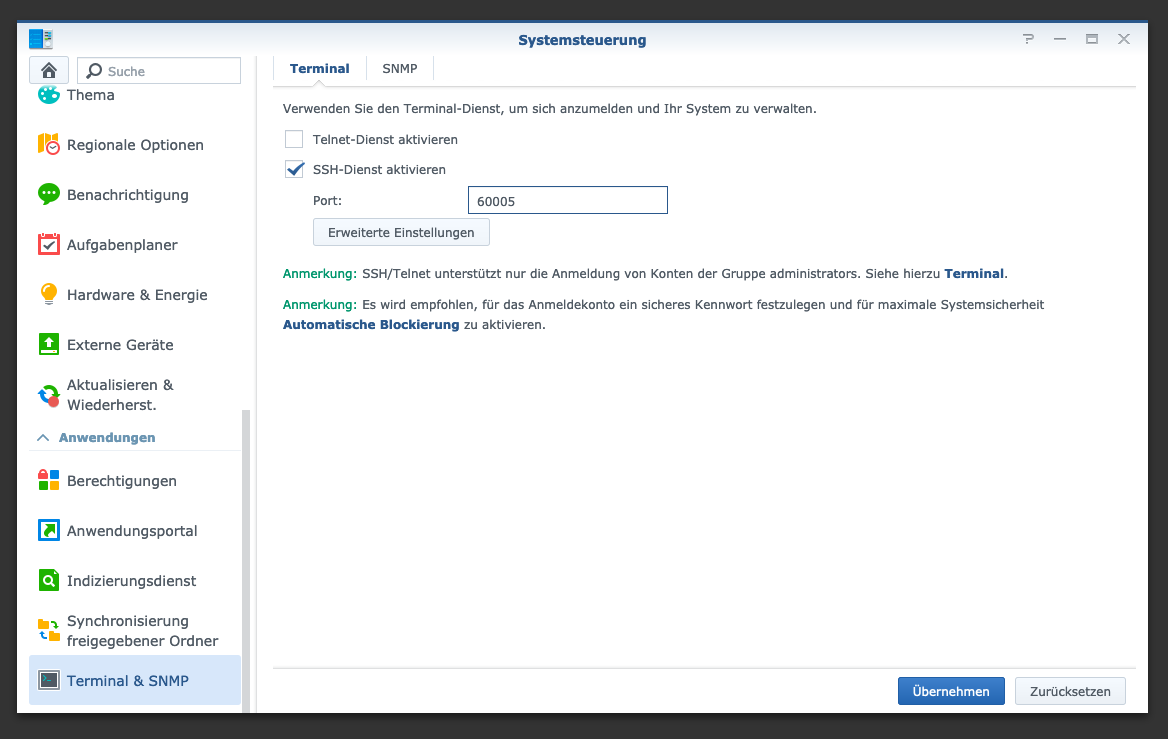
Ensuite, on peut se connecter via “SSH”, le port indiqué et le mot de passe de l’administrateur (les utilisateurs de Windows utilisent Putty ou WinSCP).
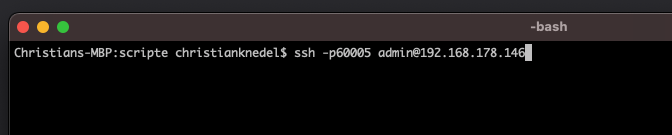
Je me connecte via Terminal, winSCP ou Putty et je laisse cette console ouverte pour plus tard.
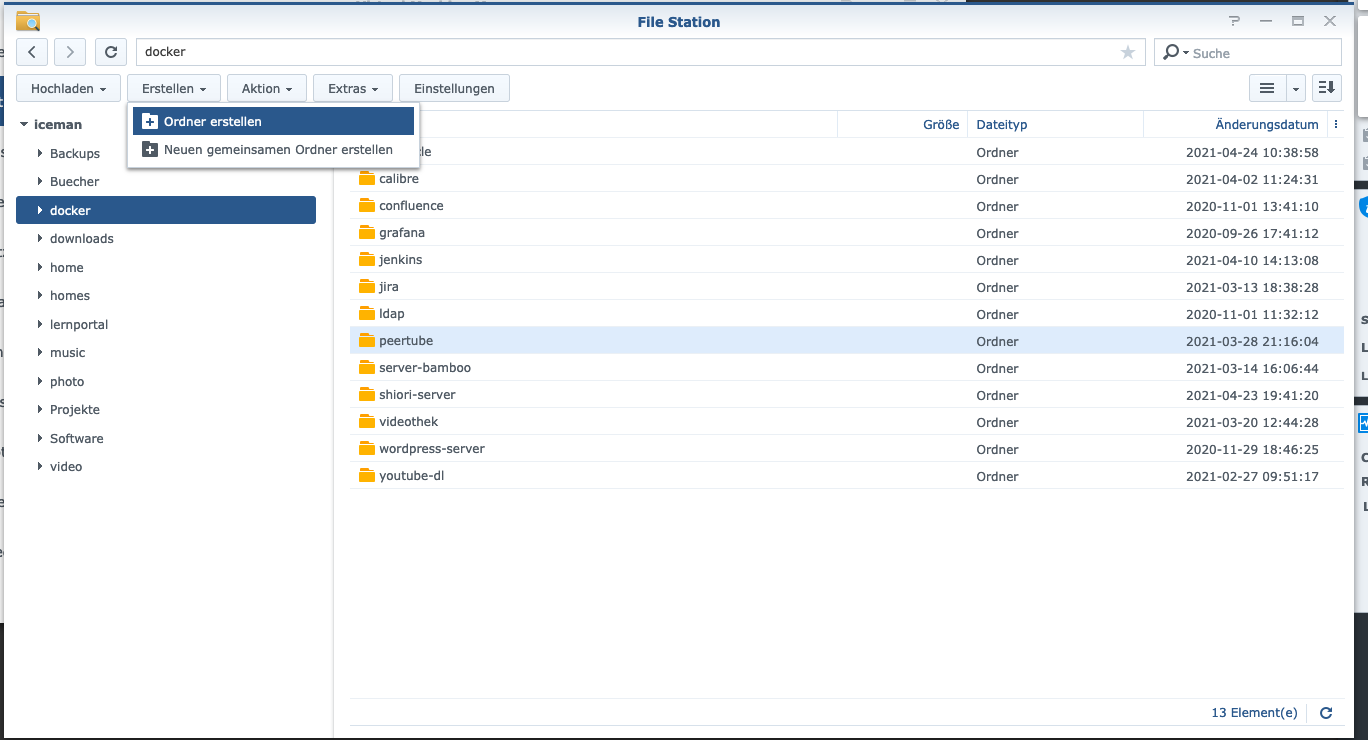
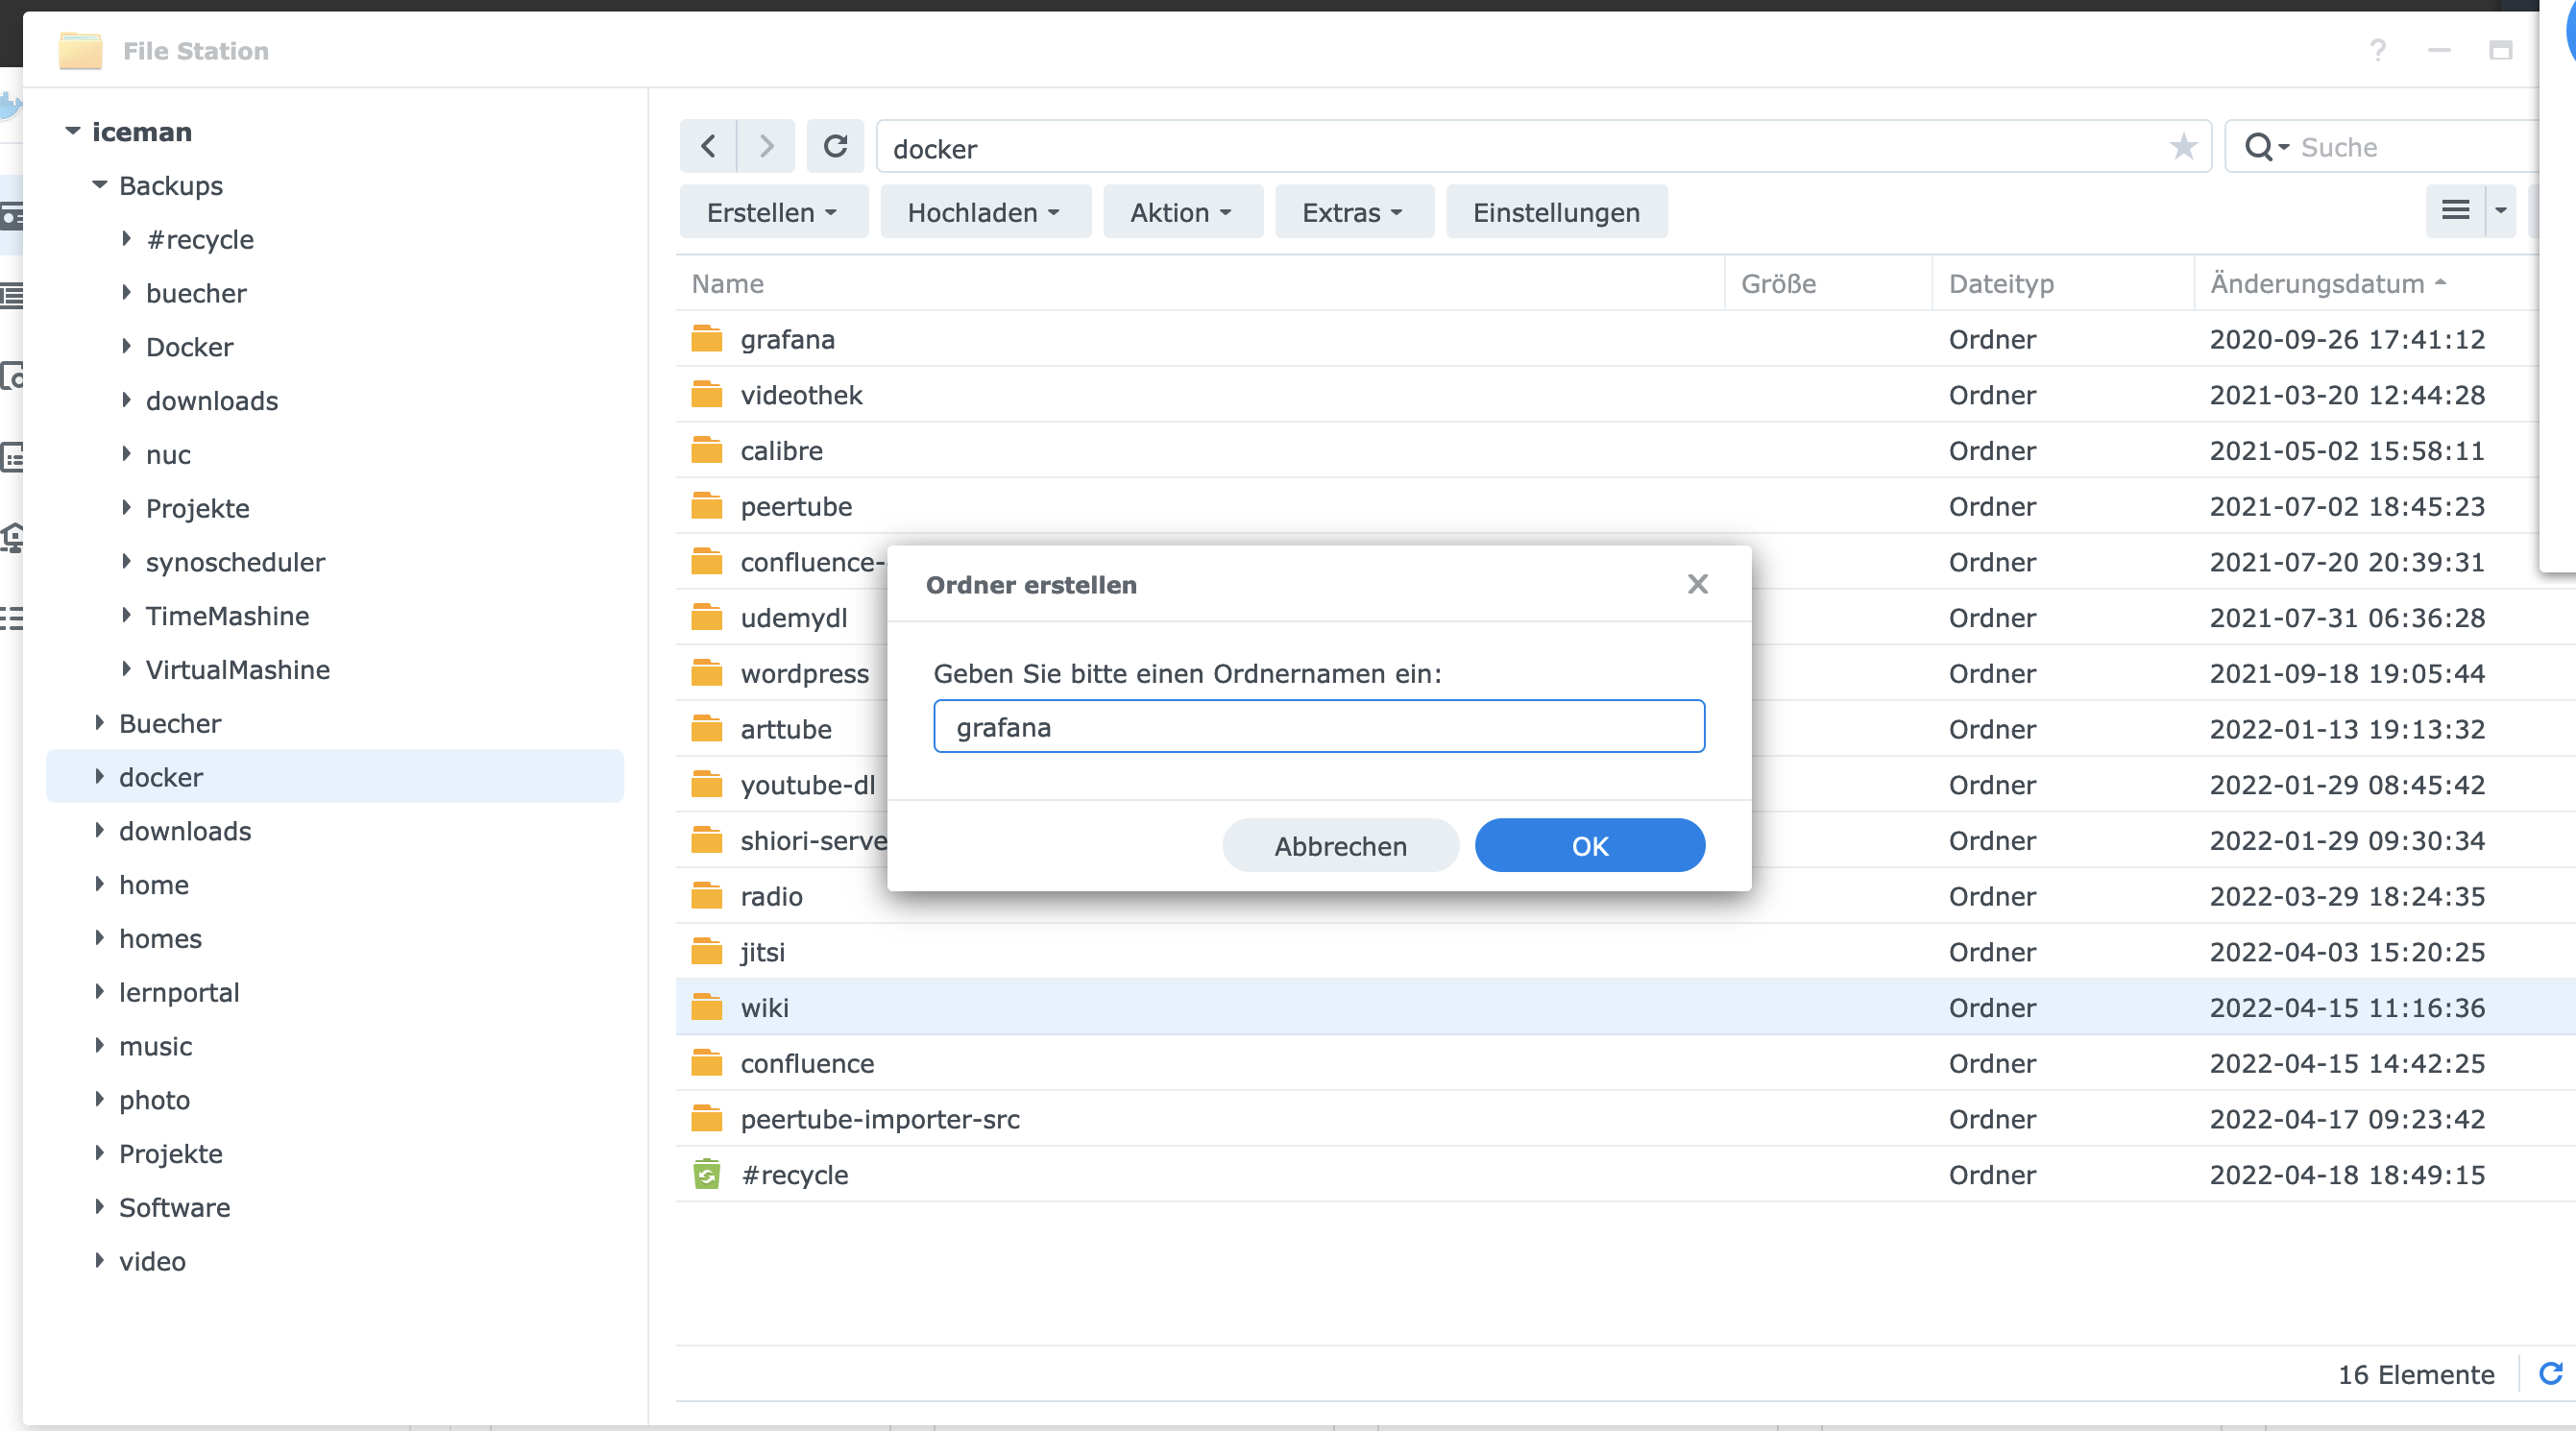
Etape 2 : Créer un dossier Grafana
Je crée un nouveau répertoire appelé “grafana” dans le répertoire Docker.
Avec la commande “cd”, je recherche le répertoire Grafana :
$ cd /volume1/docker/grafana/
version: "2"
services:
  grafana:
    image: grafana/grafana
    container_name: grafana_server_grafana
    restart: always
    ports:
      - 3000:3000
    networks:
      - grafana
    environment:
      - GF_SERVER_CERT_FILE=/etc/ssl/server.crt
      - GF_SERVER_CERT_KEY=/etc/ssl/server.key
      - GF_SERVER_PROTOCOL=https
      - GF_SERVER_HTTP_PORT=3000
    volumes:
      - ./grafana:/var/lib/grafana
      - ./ssl:/etc/ssl

  influxdb:
    image: influxdb
    container_name: grafana_server_influxdb
    restart: always
    ports:
      - 8086:8086
    networks:
      - grafana
    volumes:
      - ./influxdb:/var/lib/influxdb
      - ./ssl:/etc/ssl
    environment:
      - INFLUXDB_DB=telegraf
      - INFLUXDB_USER=telegraf
      - INFLUXDB_USER_PASSWORD=influxdb-password
      - INFLUXDB_ADMIN_ENABLED=true
      - INFLUXDB_ADMIN_USER=admin
      - INFLUXDB_ADMIN_PASSWORD=influxdb-password
      - INFLUXDB_HTTP_HTTPS_ENABLED=true
      - INFLUXDB_HTTP_HTTPS_CERTIFICATE=/etc/ssl/server.crt
      - INFLUXDB_HTTP_HTTPS_PRIVATE_KEY=/etc/ssl/server.key
      - INFLUXDB_HTTP_AUTH_ENABLED=true

  telegraf:
    image: telegraf
    container_name: grafana_server_telegraf
    restart: always
    environment:
      HOST_PROC: /rootfs/proc
      HOST_SYS: /rootfs/sys
      HOST_ETC: /rootfs/etc
    volumes:
     - ./telegraf.conf:/etc/telegraf/telegraf.conf:ro
     - /var/run/docker.sock:/var/run/docker.sock:ro
     - /sys:/rootfs/sys:ro
     - /proc:/rootfs/proc:ro
     - /etc:/rootfs/etc:ro

networks:
  grafana:
Je crée encore deux sous-dossiers pour les données :
$ mkdir grafana
$ mkdir influxdb
$ chown -R 472:472 grafana
$ mkdir ssl
$ openssl genrsa -aes256 -passout pass:your-password -out ssl/server.pass.key 4096
$ openssl rsa -passin pass:your-password -in ssl/server.pass.key -out ssl/server.key
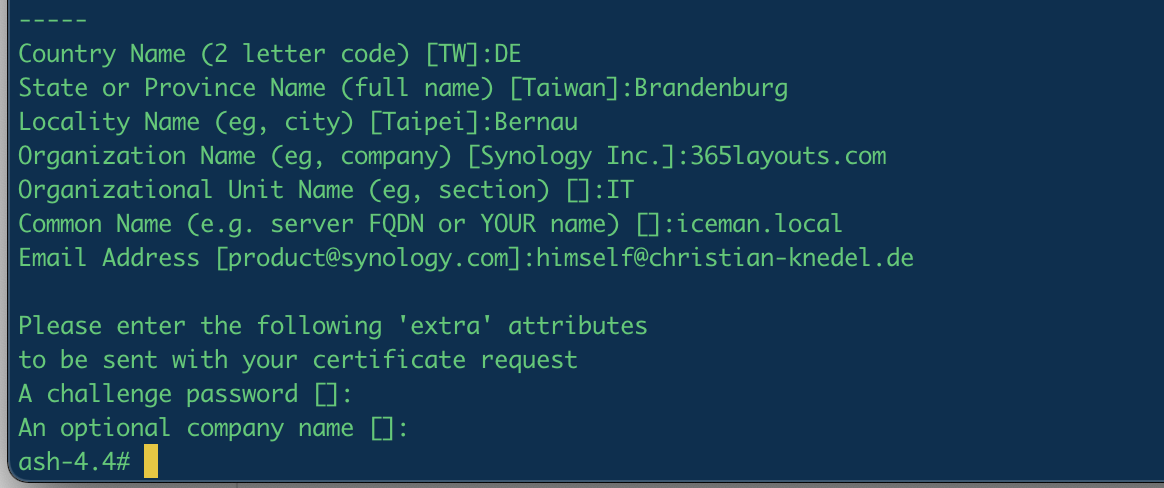
$ openssl req -new -key ssl/server.key -out ssl/server.csr
$ rm ssl/server.pass.key
$ openssl x509 -req -sha256 -days 365 -in ssl/server.csr -signkey ssl/server.key -out ssl/server.crt
En dernier lieu, je crée un fichier “telegraf.conf” avec ce contenu :
[global_tags]

[agent]
  interval = "60s"
  round_interval = true
  metric_batch_size = 1000
  metric_buffer_limit = 10000
  collection_jitter = "0s"
  flush_interval = "10s"
  flush_jitter = "0s"
  precision = ""
  hostname = "Synology DS918"
  omit_hostname = false

[[outputs.influxdb]]
urls = ["https://192.168.1.46:8086"] #synology ip
database = "telegraf"
timeout = "5s"
username = "telegraf"
password = "influxdb-password"
insecure_skip_verify = true

[[inputs.ping]]
  interval = "5s"
  urls = ["google.com", "amazon.com", "github.com"]
  count = 4
  ping_interval = 1.0
  timeout = 2.0

[[inputs.cpu]]
  percpu = true
  totalcpu = true
  collect_cpu_time = false
  report_active = false
  fielddrop = ["time_*"]

[[inputs.disk]]
  ignore_fs = ["tmpfs", "devtmpfs", "devfs", "iso9660", "overlay", "aufs", "squashfs"]

[[inputs.disk]]
  ignore_fs = ["tmpfs", "devtmpfs", "none", "iso9660", "overlay", "aufs", "squashfs"]

[[inputs.diskio]]

[[inputs.kernel]]

[[inputs.mem]]

[[inputs.swap]]

[[inputs.net]]
  fieldpass = [ "bytes*" ]

[[inputs.netstat]]

[[inputs.processes]]

[[inputs.system]]

[[inputs.net]]
  fieldpass = [ "bytes*" ]

[[inputs.docker]]
  endpoint = "unix:///var/run/docker.sock"

  gather_services = false

  container_name_include = []
  container_name_exclude = []

  timeout = "5s"

  docker_label_include = []
  docker_label_exclude = []

  perdevice = true

  total = false


##

## Synology

##
 [[inputs.snmp]]
   # List of agents to poll
   agents = [ "192.168.1.46" ] # required - enter the IP address of your Synology device

   # Polling interval
   interval = "60s"

   # Timeout for each SNMP query.
   timeout = "10s"

   # Number of retries to attempt within timeout.
   retries = 3

   # SNMP version, UAP only supports v1
   version = 2

   # SNMP community string.
   community = "public"

   # The GETBULK max-repetitions parameter
   max_repetitions = 30

   # Measurement name
   name = "snmp.SYNO"

   #  System name (hostname)
   [[inputs.snmp.field]]
     is_tag = true
     name = "sysName"
     oid = "RFC1213-MIB::sysName.0"
   #  System vendor OID
   [[inputs.snmp.field]]
     name = "sysObjectID"
     oid = "RFC1213-MIB::sysObjectID.0"
   #  System description
   [[inputs.snmp.field]]
     name = "sysDescr"
     oid = "RFC1213-MIB::sysDescr.0"
   #  System contact
   [[inputs.snmp.field]]
     name = "sysContact"
     oid = "RFC1213-MIB::sysContact.0"
   #  System location
   [[inputs.snmp.field]]
     name = "sysLocation"
     oid = "RFC1213-MIB::sysLocation.0"
   #  System uptime
   [[inputs.snmp.field]]
     name = "sysUpTime"
     oid = "RFC1213-MIB::sysUpTime.0"
   # Inet interface
   [[inputs.snmp.table]]
     oid = "IF-MIB::ifTable"
     [[inputs.snmp.table.field]]
       is_tag = true
     oid = "IF-MIB::ifDescr"
   #Syno disk
   [[inputs.snmp.table]]
     oid = "SYNOLOGY-DISK-MIB::diskTable"
     [[inputs.snmp.table.field]]
       is_tag = true
     oid = "SYNOLOGY-DISK-MIB::diskID"
   #Syno raid
   [[inputs.snmp.table]]
     oid = "SYNOLOGY-RAID-MIB::raidTable"
     [[inputs.snmp.table.field]]
       is_tag = true
     oid = "SYNOLOGY-RAID-MIB::raidName"
   #Syno load
   [[inputs.snmp.table]]
     oid = "UCD-SNMP-MIB::laTable"
     [[inputs.snmp.table.field]]
       is_tag = true
     oid = "UCD-SNMP-MIB::laNames"
   #  System memTotalSwap
   [[inputs.snmp.field]]
     name = "memTotalSwap"
     oid = "UCD-SNMP-MIB::memTotalSwap.0"
   #  System memAvailSwap
   [[inputs.snmp.field]]
     name = "memAvailSwap"
     oid = "UCD-SNMP-MIB::memAvailSwap.0"
   #  System memTotalReal
   [[inputs.snmp.field]]
     name = "memTotalReal"
     oid = "UCD-SNMP-MIB::memTotalReal.0"
   #  System memAvailReal
   [[inputs.snmp.field]]
     name = "memAvailReal"
     oid = "UCD-SNMP-MIB::memAvailReal.0"
   #  System memTotalFree
   [[inputs.snmp.field]]
     name = "memTotalFree"
     oid = "UCD-SNMP-MIB::memTotalFree.0"
   #  System Status
   [[inputs.snmp.field]]
     name = "systemStatus"
     oid = "SYNOLOGY-SYSTEM-MIB::systemStatus.0"
   #  System temperature
   [[inputs.snmp.field]]
     name = "temperature"
     oid = "SYNOLOGY-SYSTEM-MIB::temperature.0"
   #  System powerStatus
   [[inputs.snmp.field]]
     name = "powerStatus"
     oid = "SYNOLOGY-SYSTEM-MIB::powerStatus.0"
   #  System systemFanStatus
   [[inputs.snmp.field]]
     name = "systemFanStatus"
     oid = "SYNOLOGY-SYSTEM-MIB::systemFanStatus.0"
   #  System cpuFanStatus
   [[inputs.snmp.field]]
     name = "cpuFanStatus"
     oid = "SYNOLOGY-SYSTEM-MIB::cpuFanStatus.0"
   #  System modelName
   [[inputs.snmp.field]]
     name = "modelName"
     oid = "SYNOLOGY-SYSTEM-MIB::modelName.0"
   #  System serialNumber
   [[inputs.snmp.field]]
     name = "serialNumber"
     oid = "SYNOLOGY-SYSTEM-MIB::serialNumber.0"
   #  System version
   [[inputs.snmp.field]]
     name = "version"
     oid = "SYNOLOGY-SYSTEM-MIB::version.0"
   #  System upgradeAvailable
   [[inputs.snmp.field]]
     name = "upgradeAvailable"
     oid = "SYNOLOGY-SYSTEM-MIB::upgradeAvailable.0"
   # System volume
   [[inputs.snmp.table]]
     oid = "HOST-RESOURCES-MIB::hrStorageTable"
   [[inputs.snmp.table.field]]
       is_tag = true
     oid = "HOST-RESOURCES-MIB::hrStorageDescr"
   # System ssCpuUser
   [[inputs.snmp.field]]
     name = "ssCpuUser"
     oid = ".1.3.6.1.4.1.2021.11.9.0"
   # System ssCpuSystem
   [[inputs.snmp.field]]
     name = "ssCpuSystem"
     oid = ".1.3.6.1.4.1.2021.11.10.0"
   # System ssCpuIdle
   [[inputs.snmp.field]]
     name = "ssCpuIdle"
     oid = ".1.3.6.1.4.1.2021.11.11.0"
   # Service users CIFS
   [[inputs.snmp.table.field]]
     name = "usersCIFS"
     oid = "SYNOLOGY-SERVICES-MIB::serviceUsers"
     oid_index_suffix = "1"
   # Service users AFP
   [[inputs.snmp.table.field]]
     name = "usersAFP"
     oid = "SYNOLOGY-SERVICES-MIB::serviceUsers"
     oid_index_suffix = "2"
   # Service users NFS
   [[inputs.snmp.table.field]]
     name = "usersNFS"
     oid = "SYNOLOGY-SERVICES-MIB::serviceUsers"
     oid_index_suffix = "3"
   # Service users FTP
   [[inputs.snmp.table.field]]
     name = "usersFTP"
     oid = "SYNOLOGY-SERVICES-MIB::serviceUsers"
     oid_index_suffix = "4"
   # Service users SFTP
   [[inputs.snmp.table.field]]
     name = "usersSFTP"
     oid = "SYNOLOGY-SERVICES-MIB::serviceUsers"
     oid_index_suffix = "5"
   # Service users HTTP
   [[inputs.snmp.table.field]]
     name = "usersHTTP"
     oid = "SYNOLOGY-SERVICES-MIB::serviceUsers"
     oid_index_suffix = "6"
   # Service users TELNET
   [[inputs.snmp.table.field]]
     name = "usersTELNET"
     oid = "SYNOLOGY-SERVICES-MIB::serviceUsers"
     oid_index_suffix = "7"
   # Service users SSH
   [[inputs.snmp.table.field]]
     name = "usersSSH"
     oid = "SYNOLOGY-SERVICES-MIB::serviceUsers"
     oid_index_suffix = "8"
   # Service users OTHER
   [[inputs.snmp.table.field]]
     name = "usersOTHER"
     oid = "SYNOLOGY-SERVICES-MIB::serviceUsers"
     oid_index_suffix = "9"
   # UPS Status
   [[inputs.snmp.table.field]]
     name = "upsStatus"
     oid = "SYNOLOGY-UPS-MIB::upsInfoStatus"
   # UPS Load
   [[inputs.snmp.table.field]]
     name = "upsLoad"
     oid = "SYNOLOGY-UPS-MIB::upsInfoLoadValue"
   # UPS Battery Charge
   [[inputs.snmp.table.field]]
     name = "upsCharge"
     oid = "SYNOLOGY-UPS-MIB::upsBatteryChargeValue"
   # UPS Battery Charge Warning
   [[inputs.snmp.table.field]]
     name = "upsWarning"
     oid = "SYNOLOGY-UPS-MIB::upsBatteryChargeWarning"

[[inputs.docker]]
  endpoint = "unix:///var/run/docker.sock"

  gather_services = false

  container_name_include = []
  container_name_exclude = []

  timeout = "5s"

  docker_label_include = []
  docker_label_exclude = []

  perdevice = true

  total = false
Maintenant, démarre le serveur Grafana avec cet appel Compose :
$ sudo docker-compose -f grafana.yml up
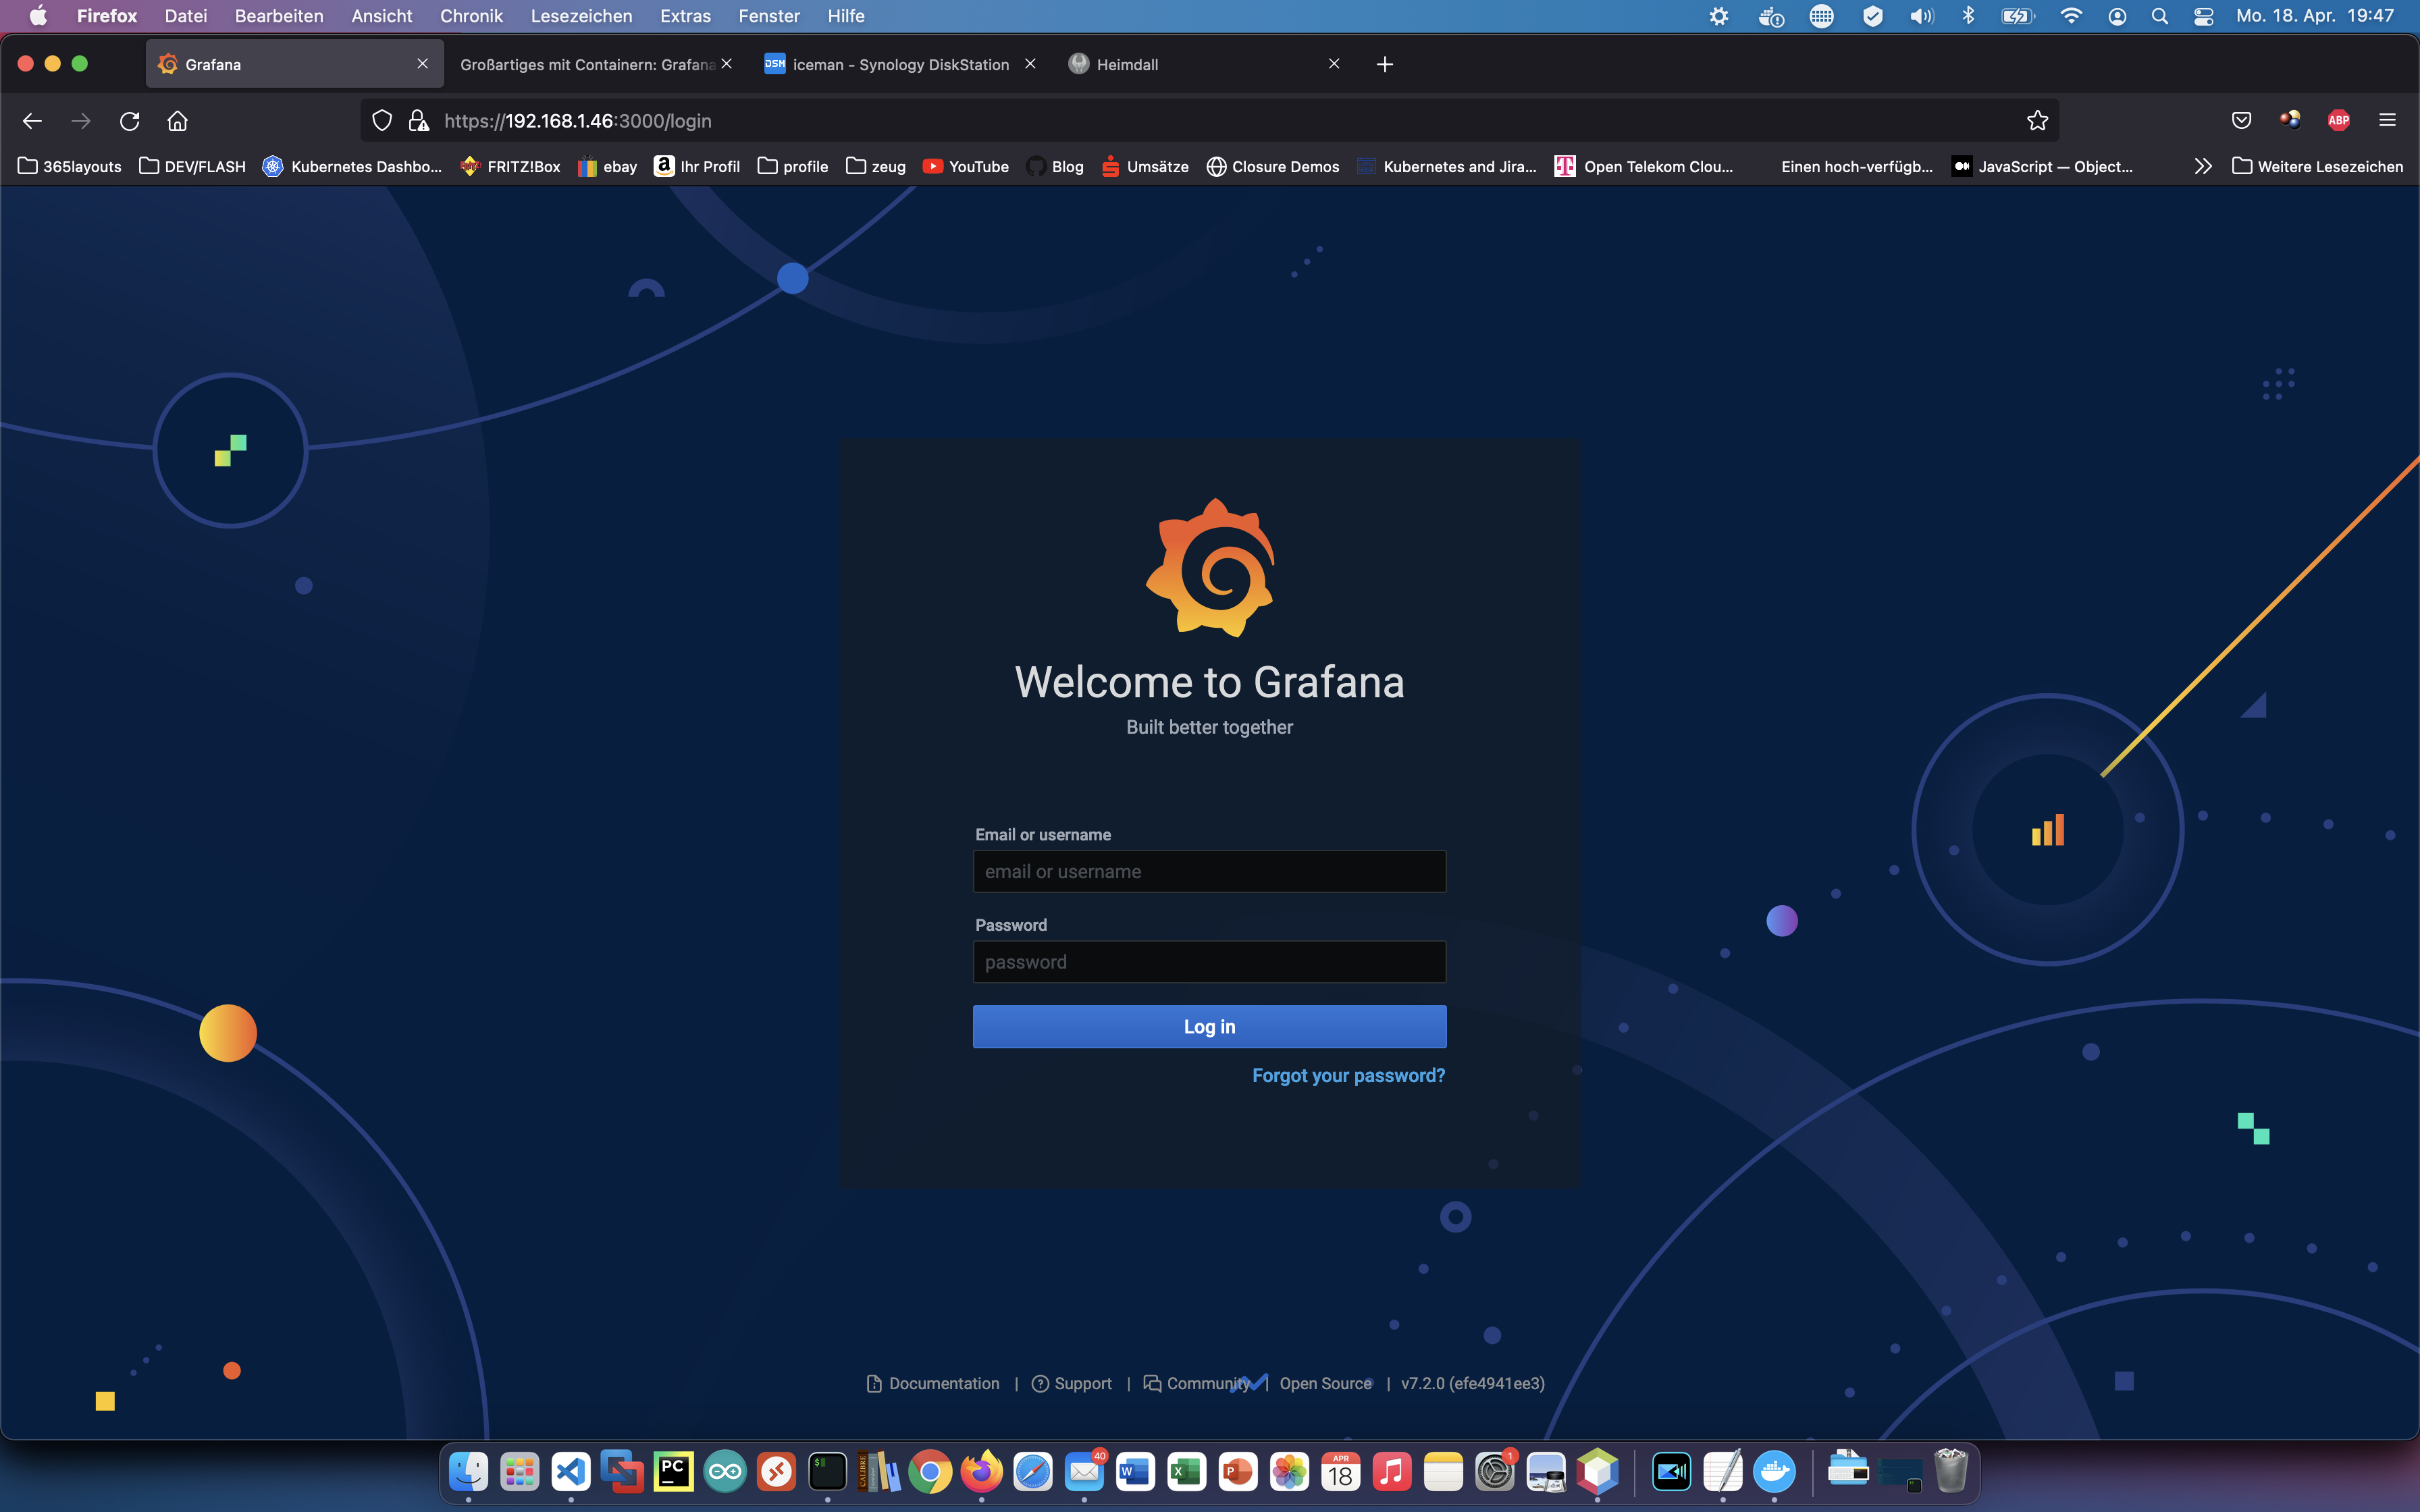
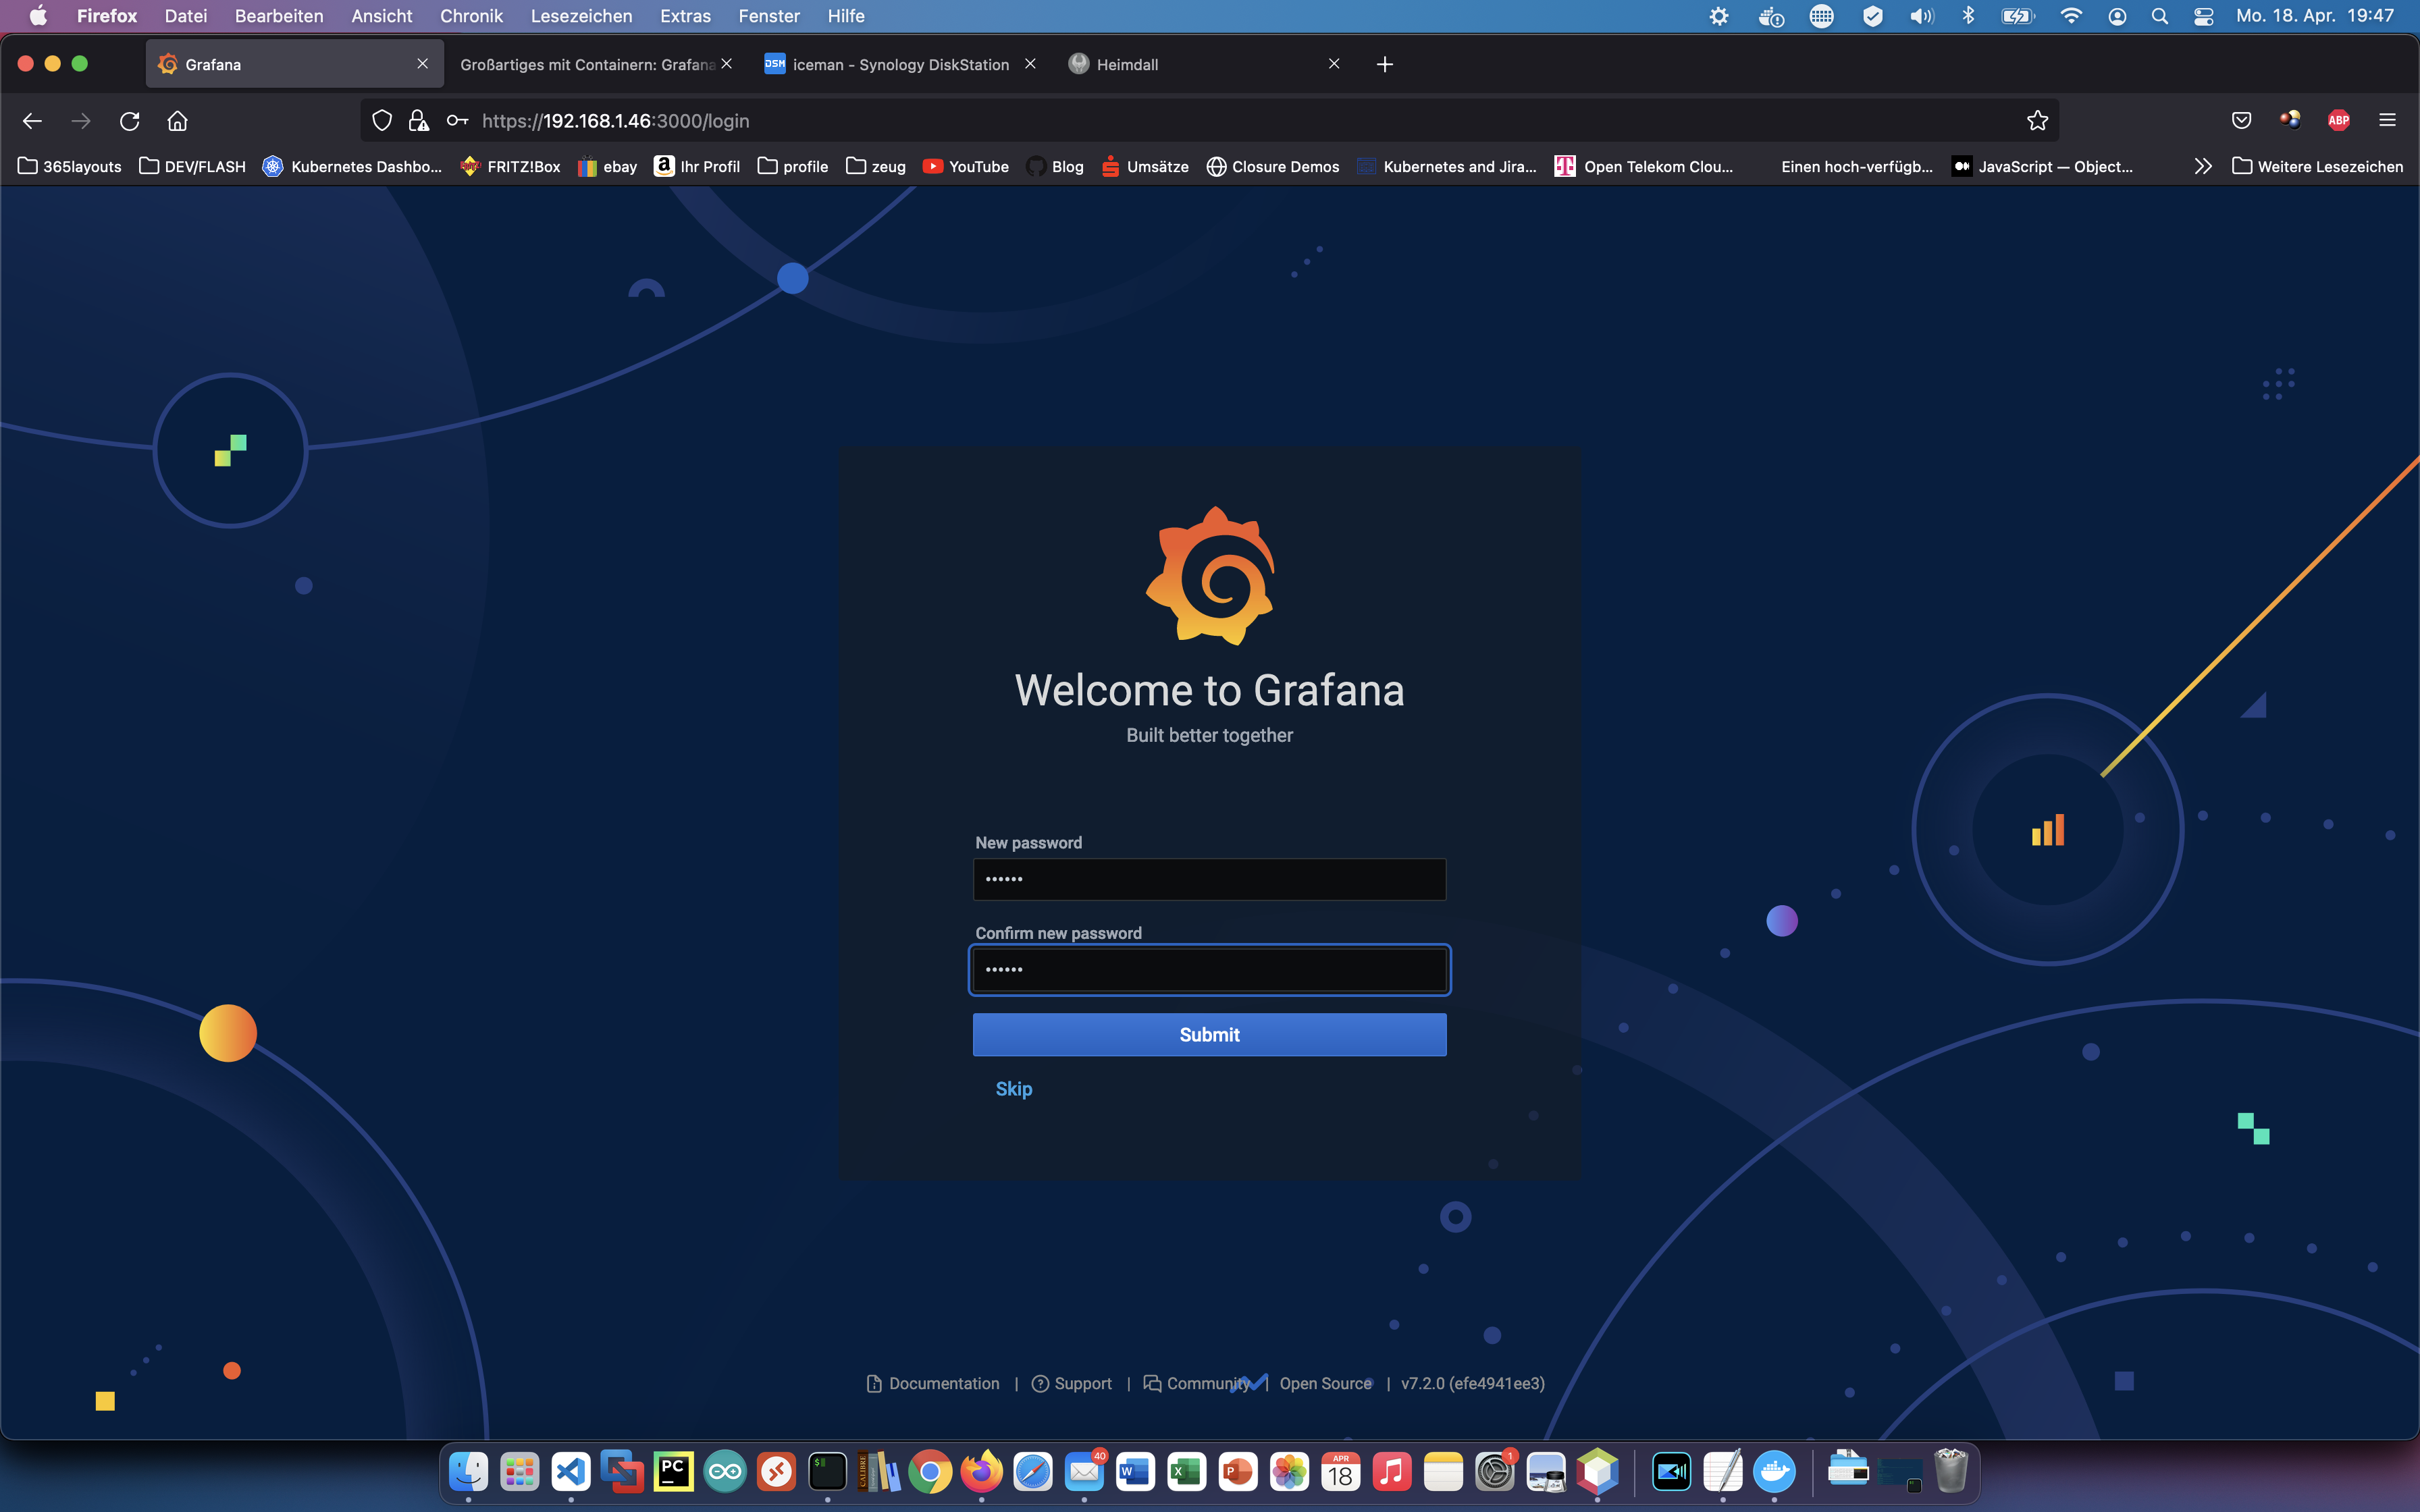
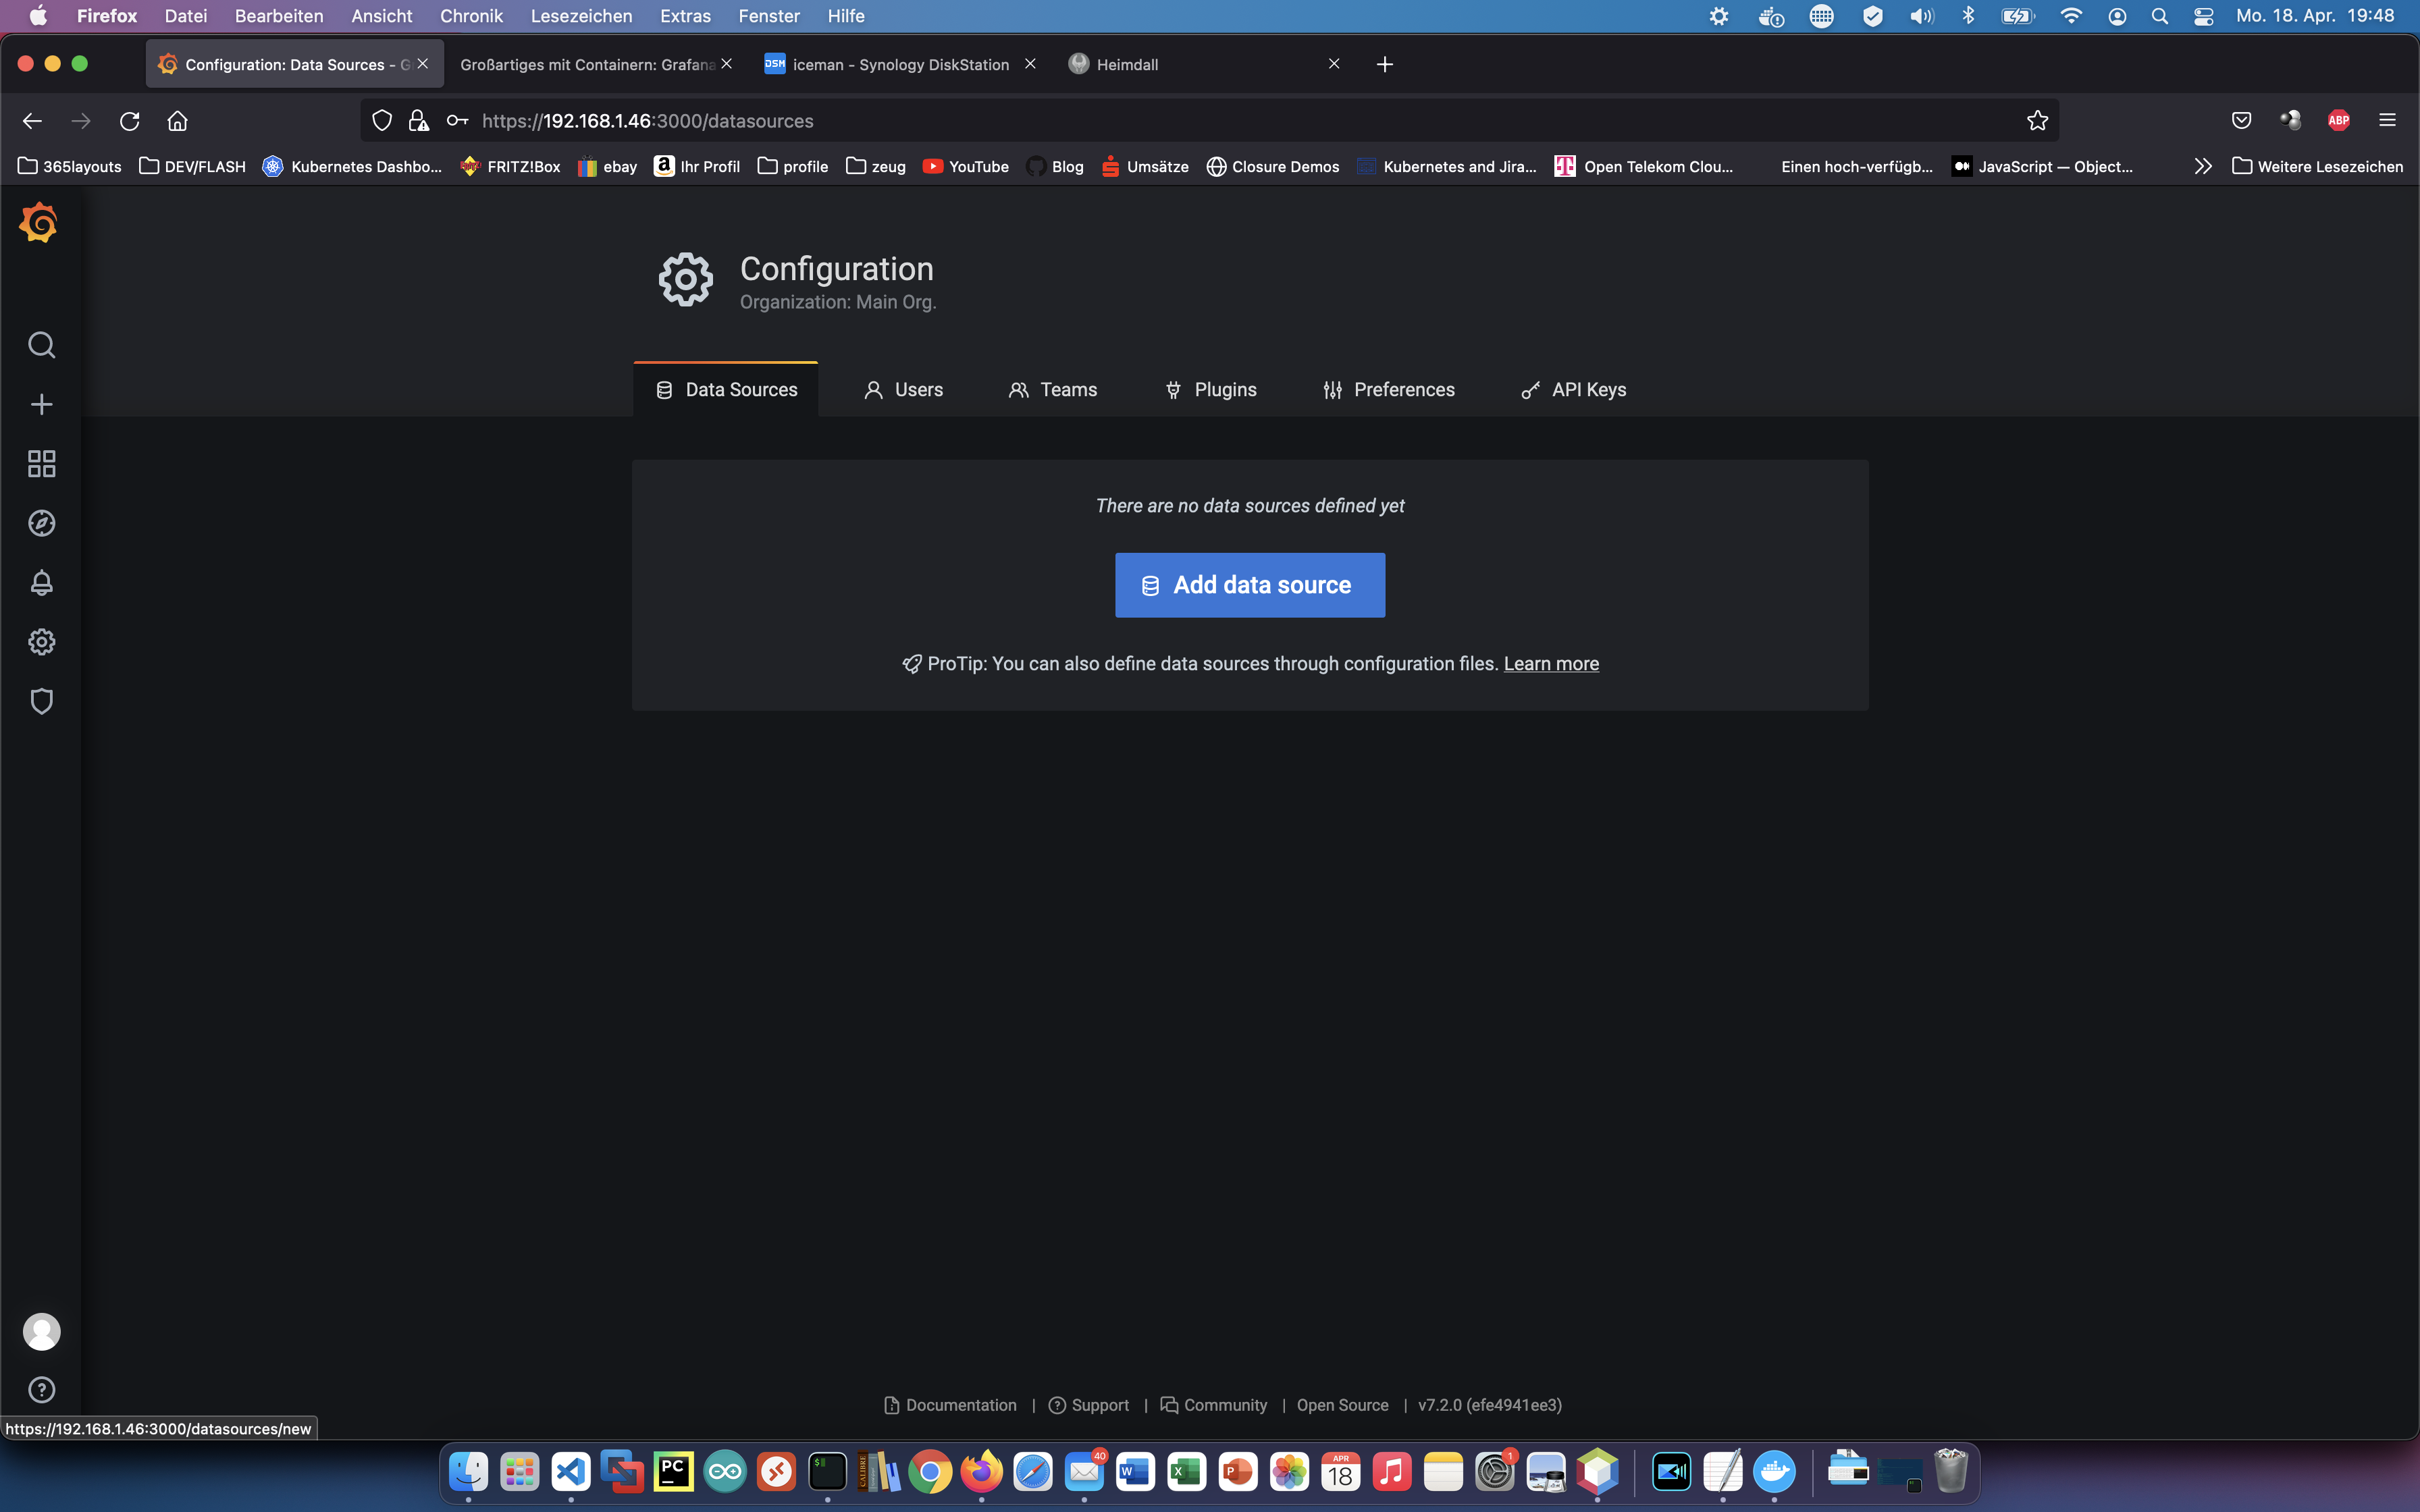
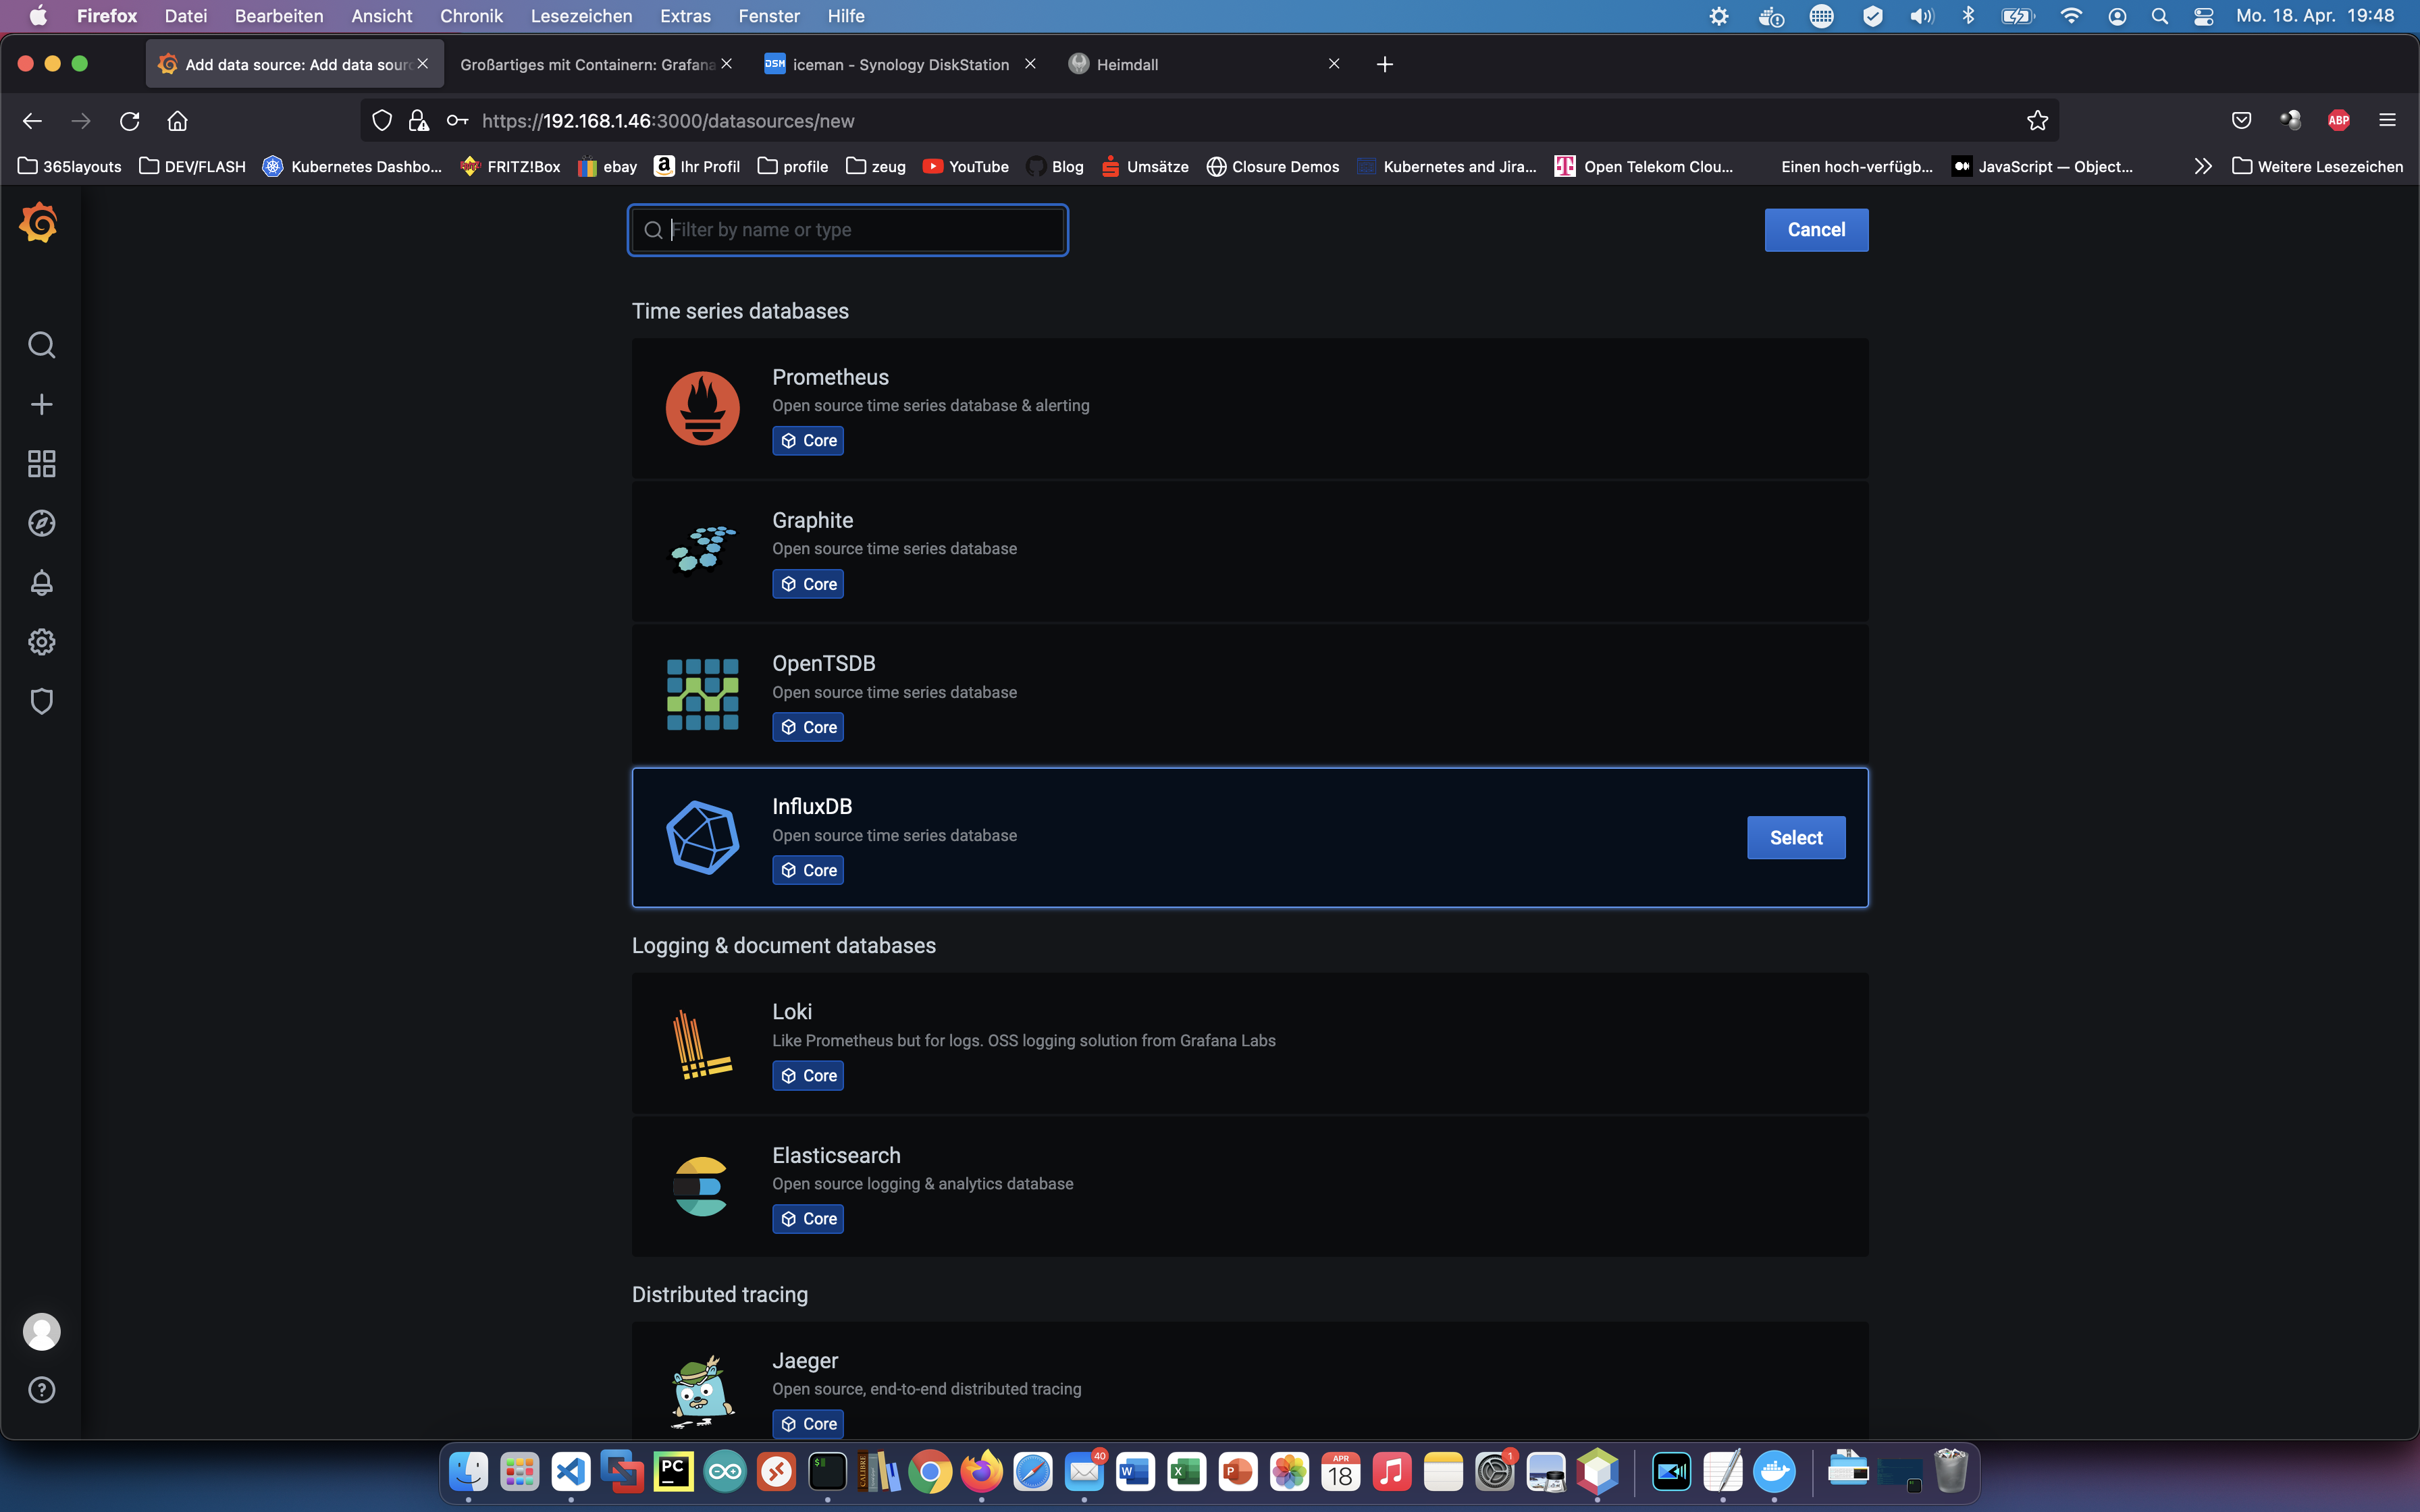
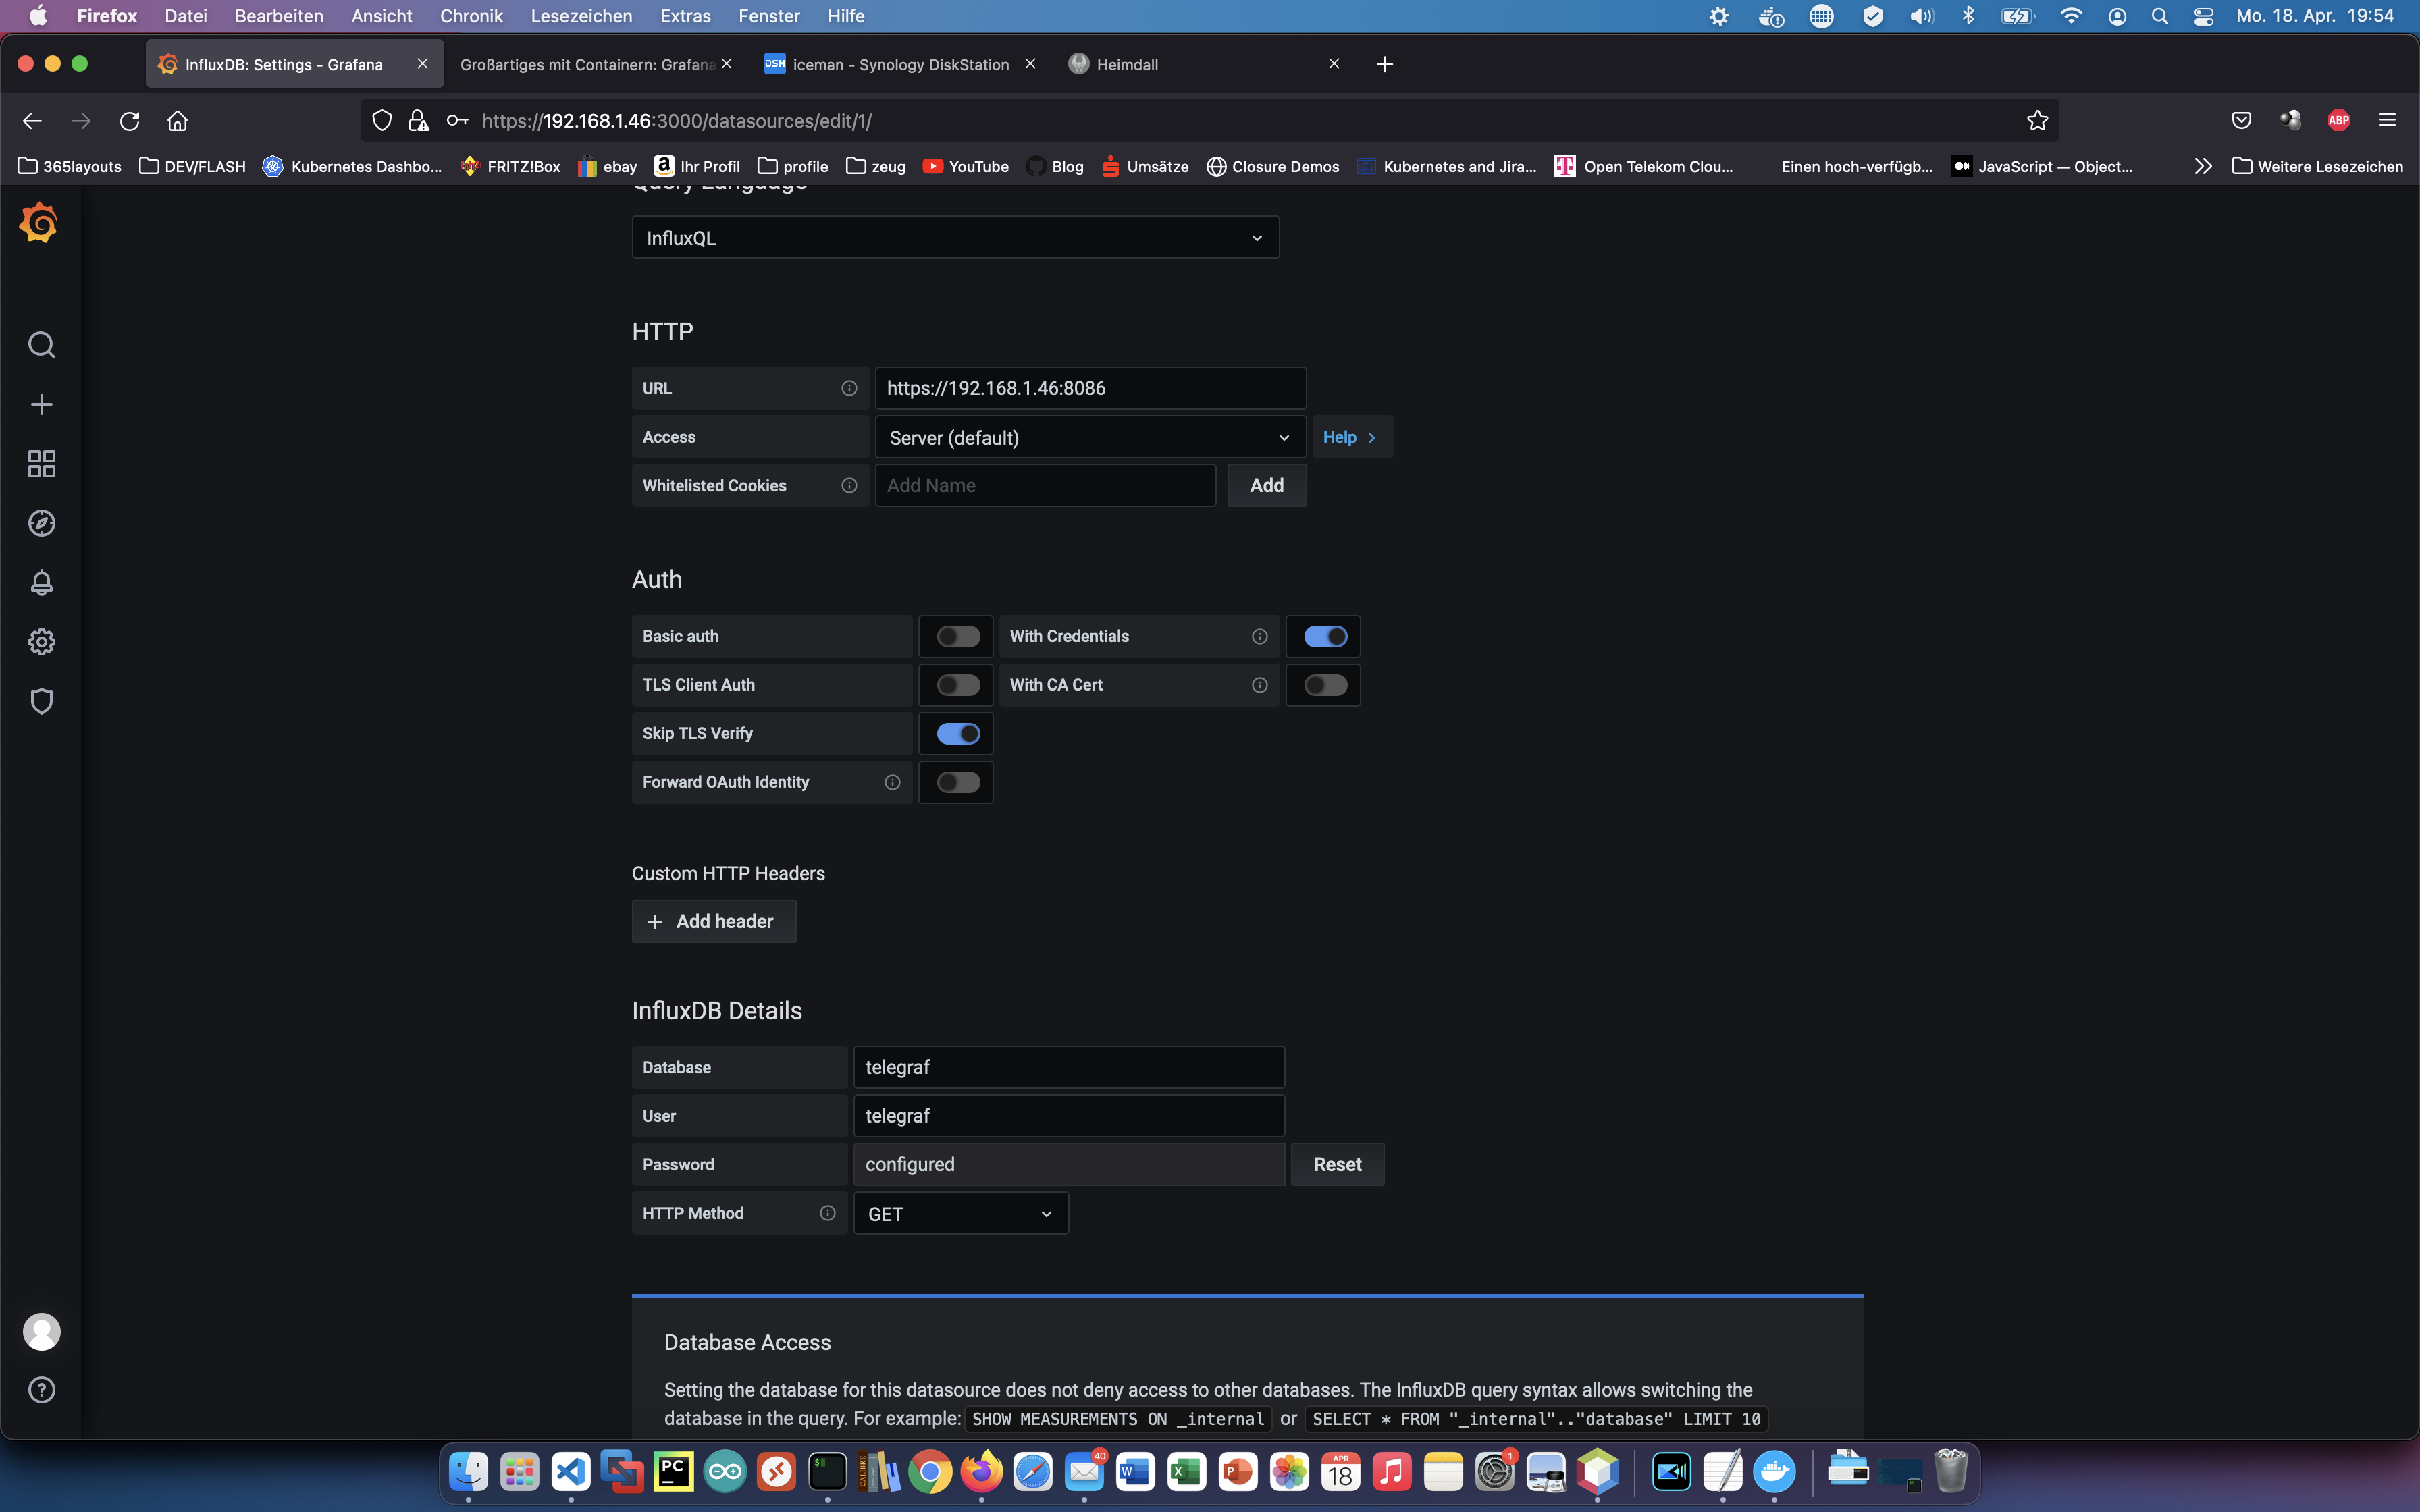
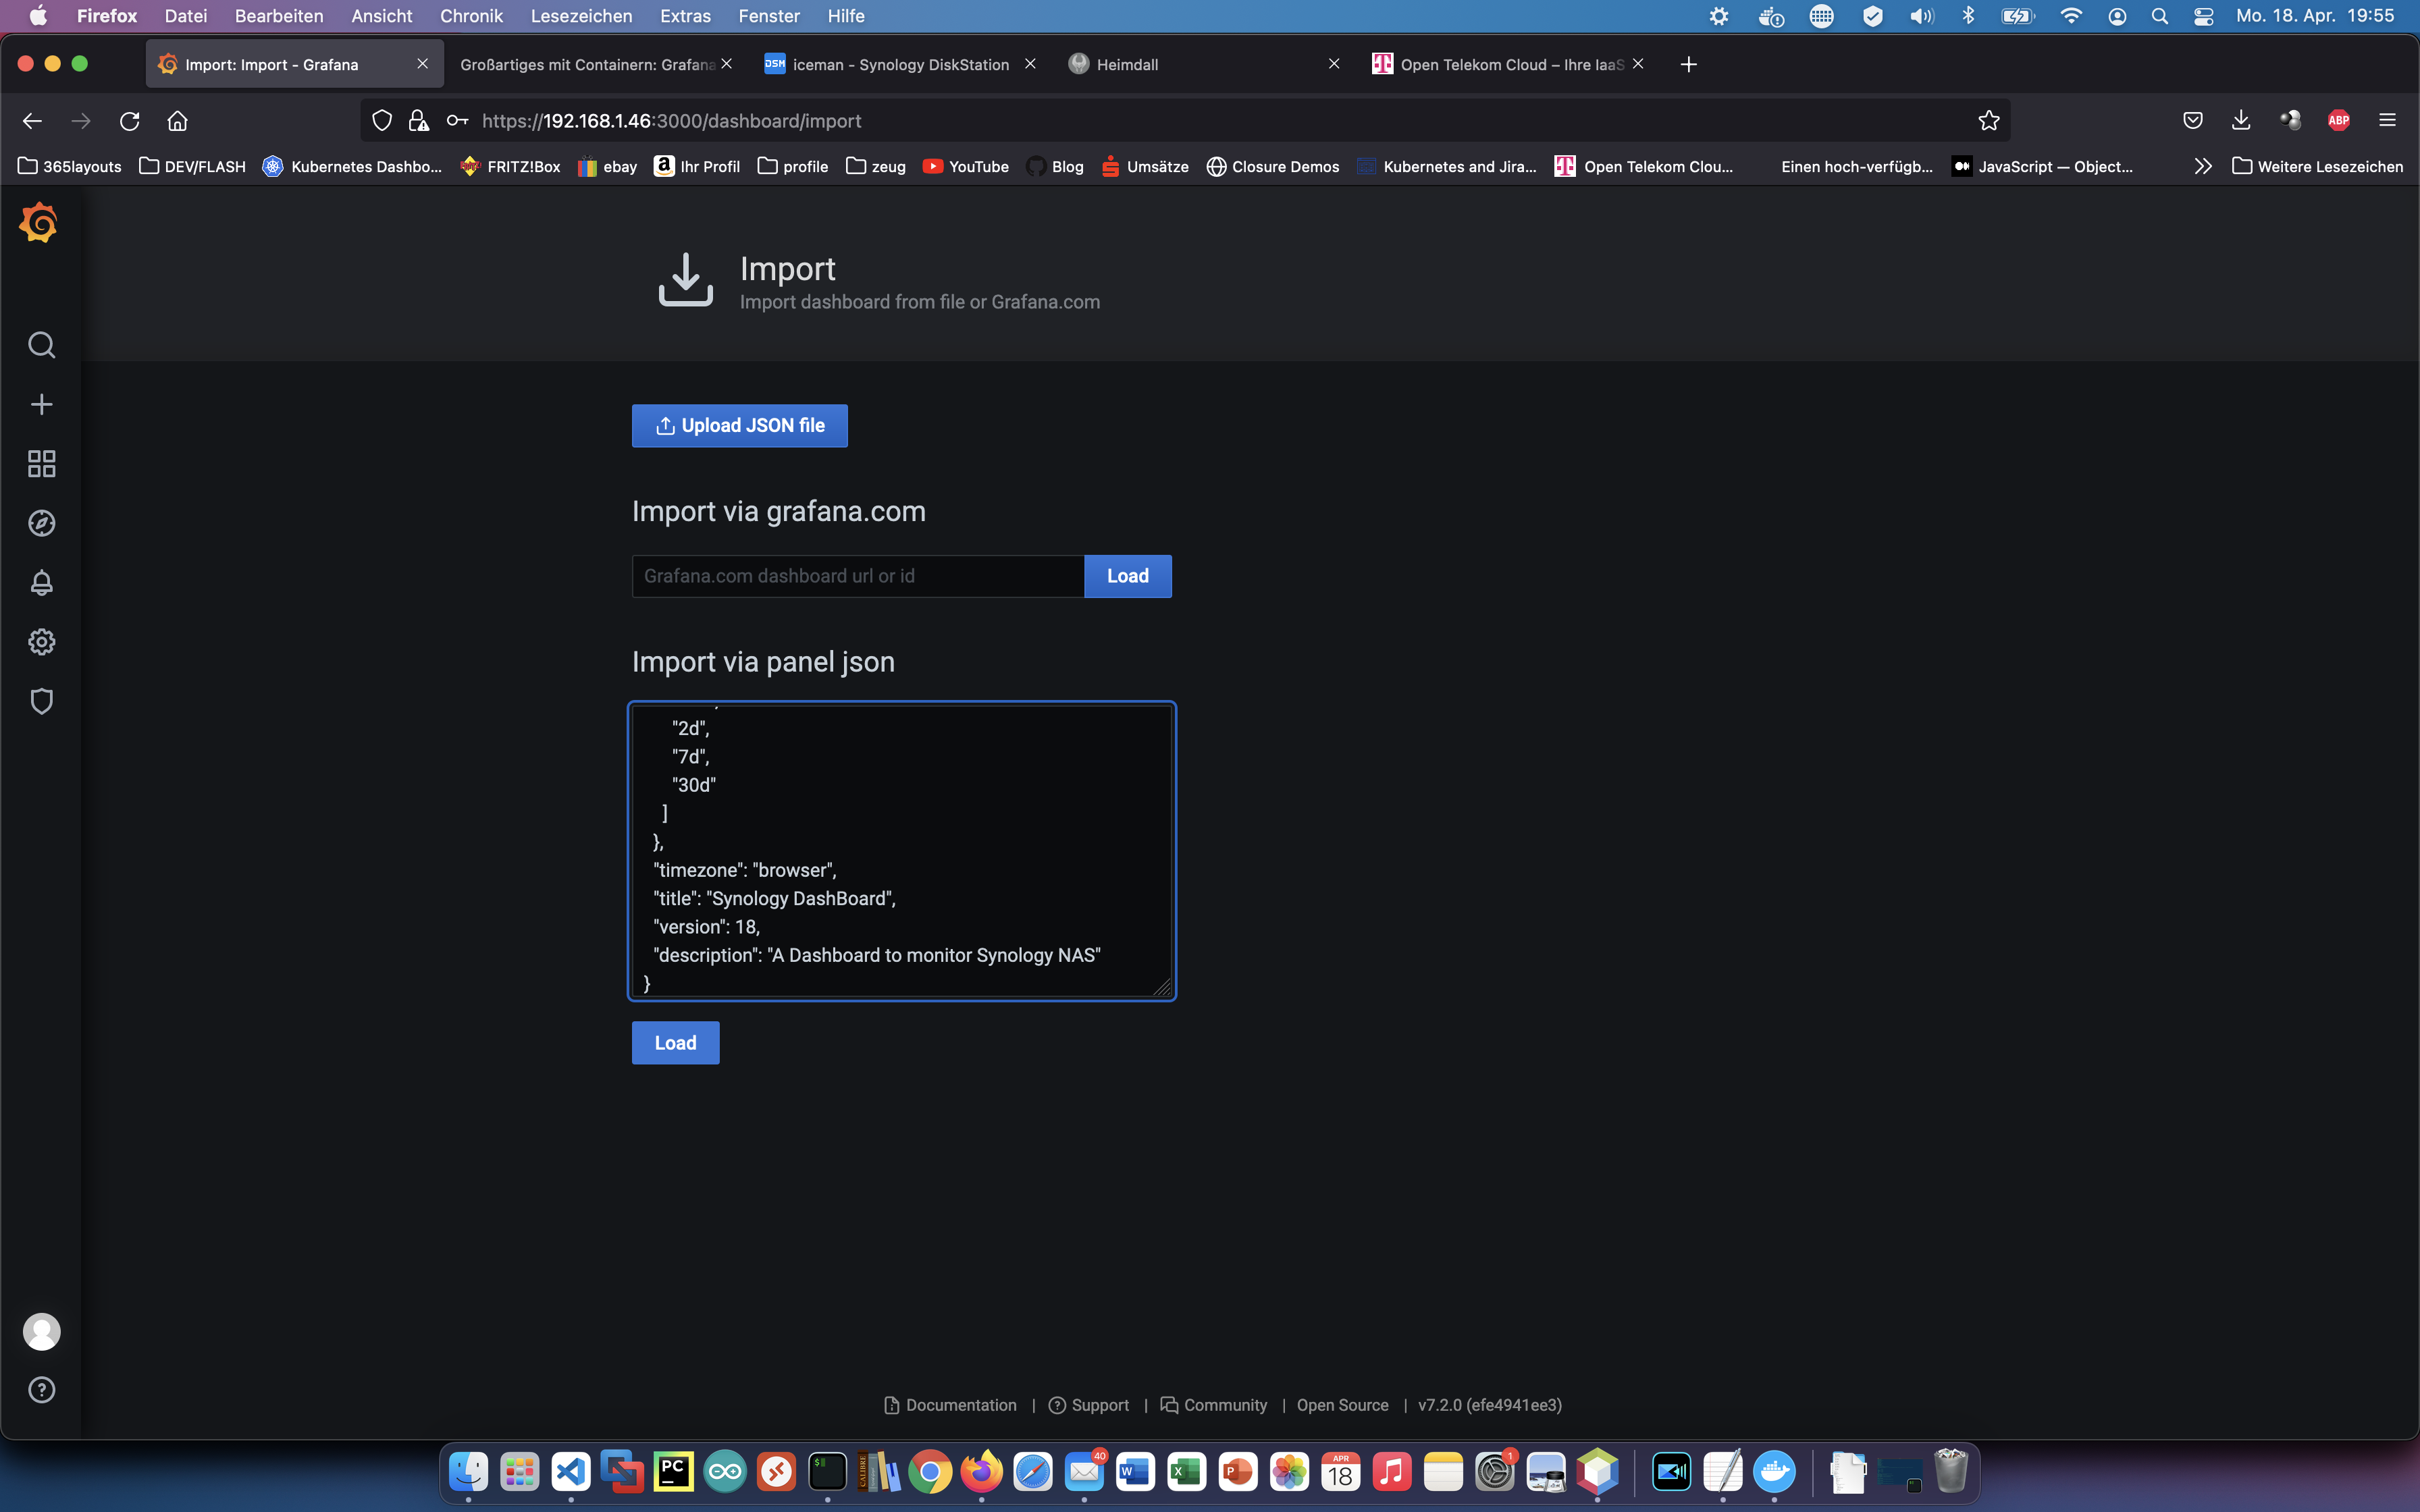
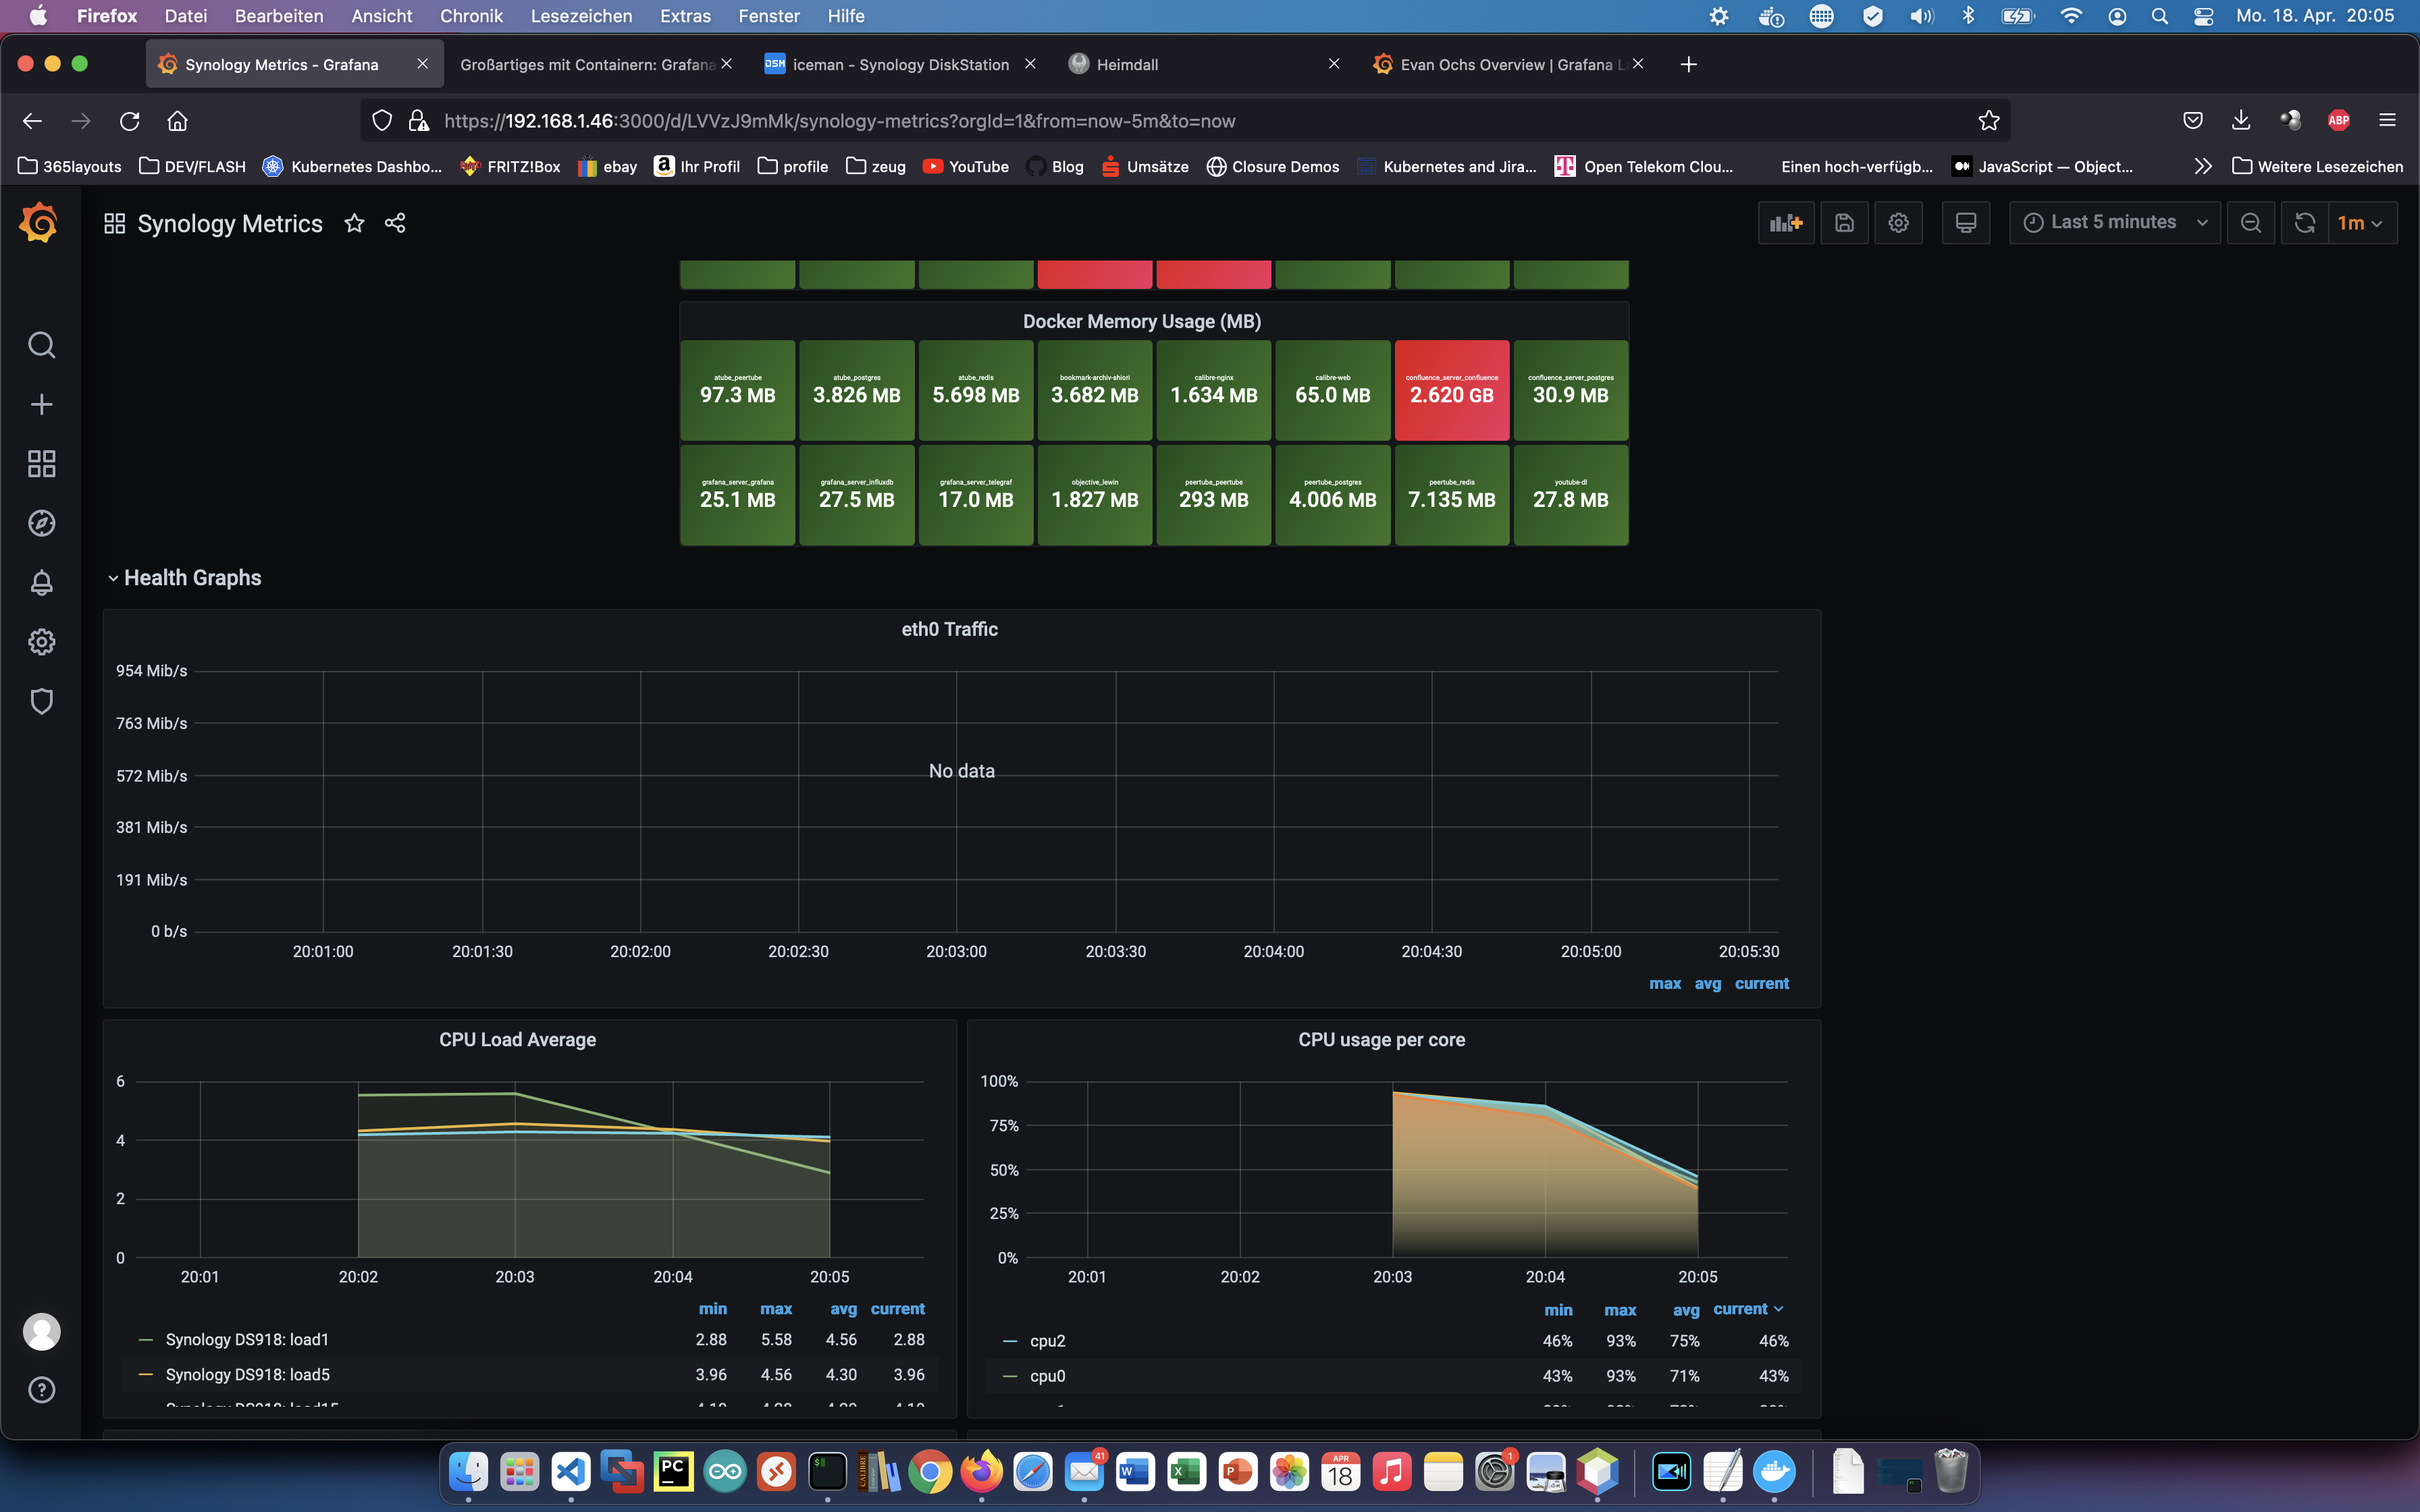
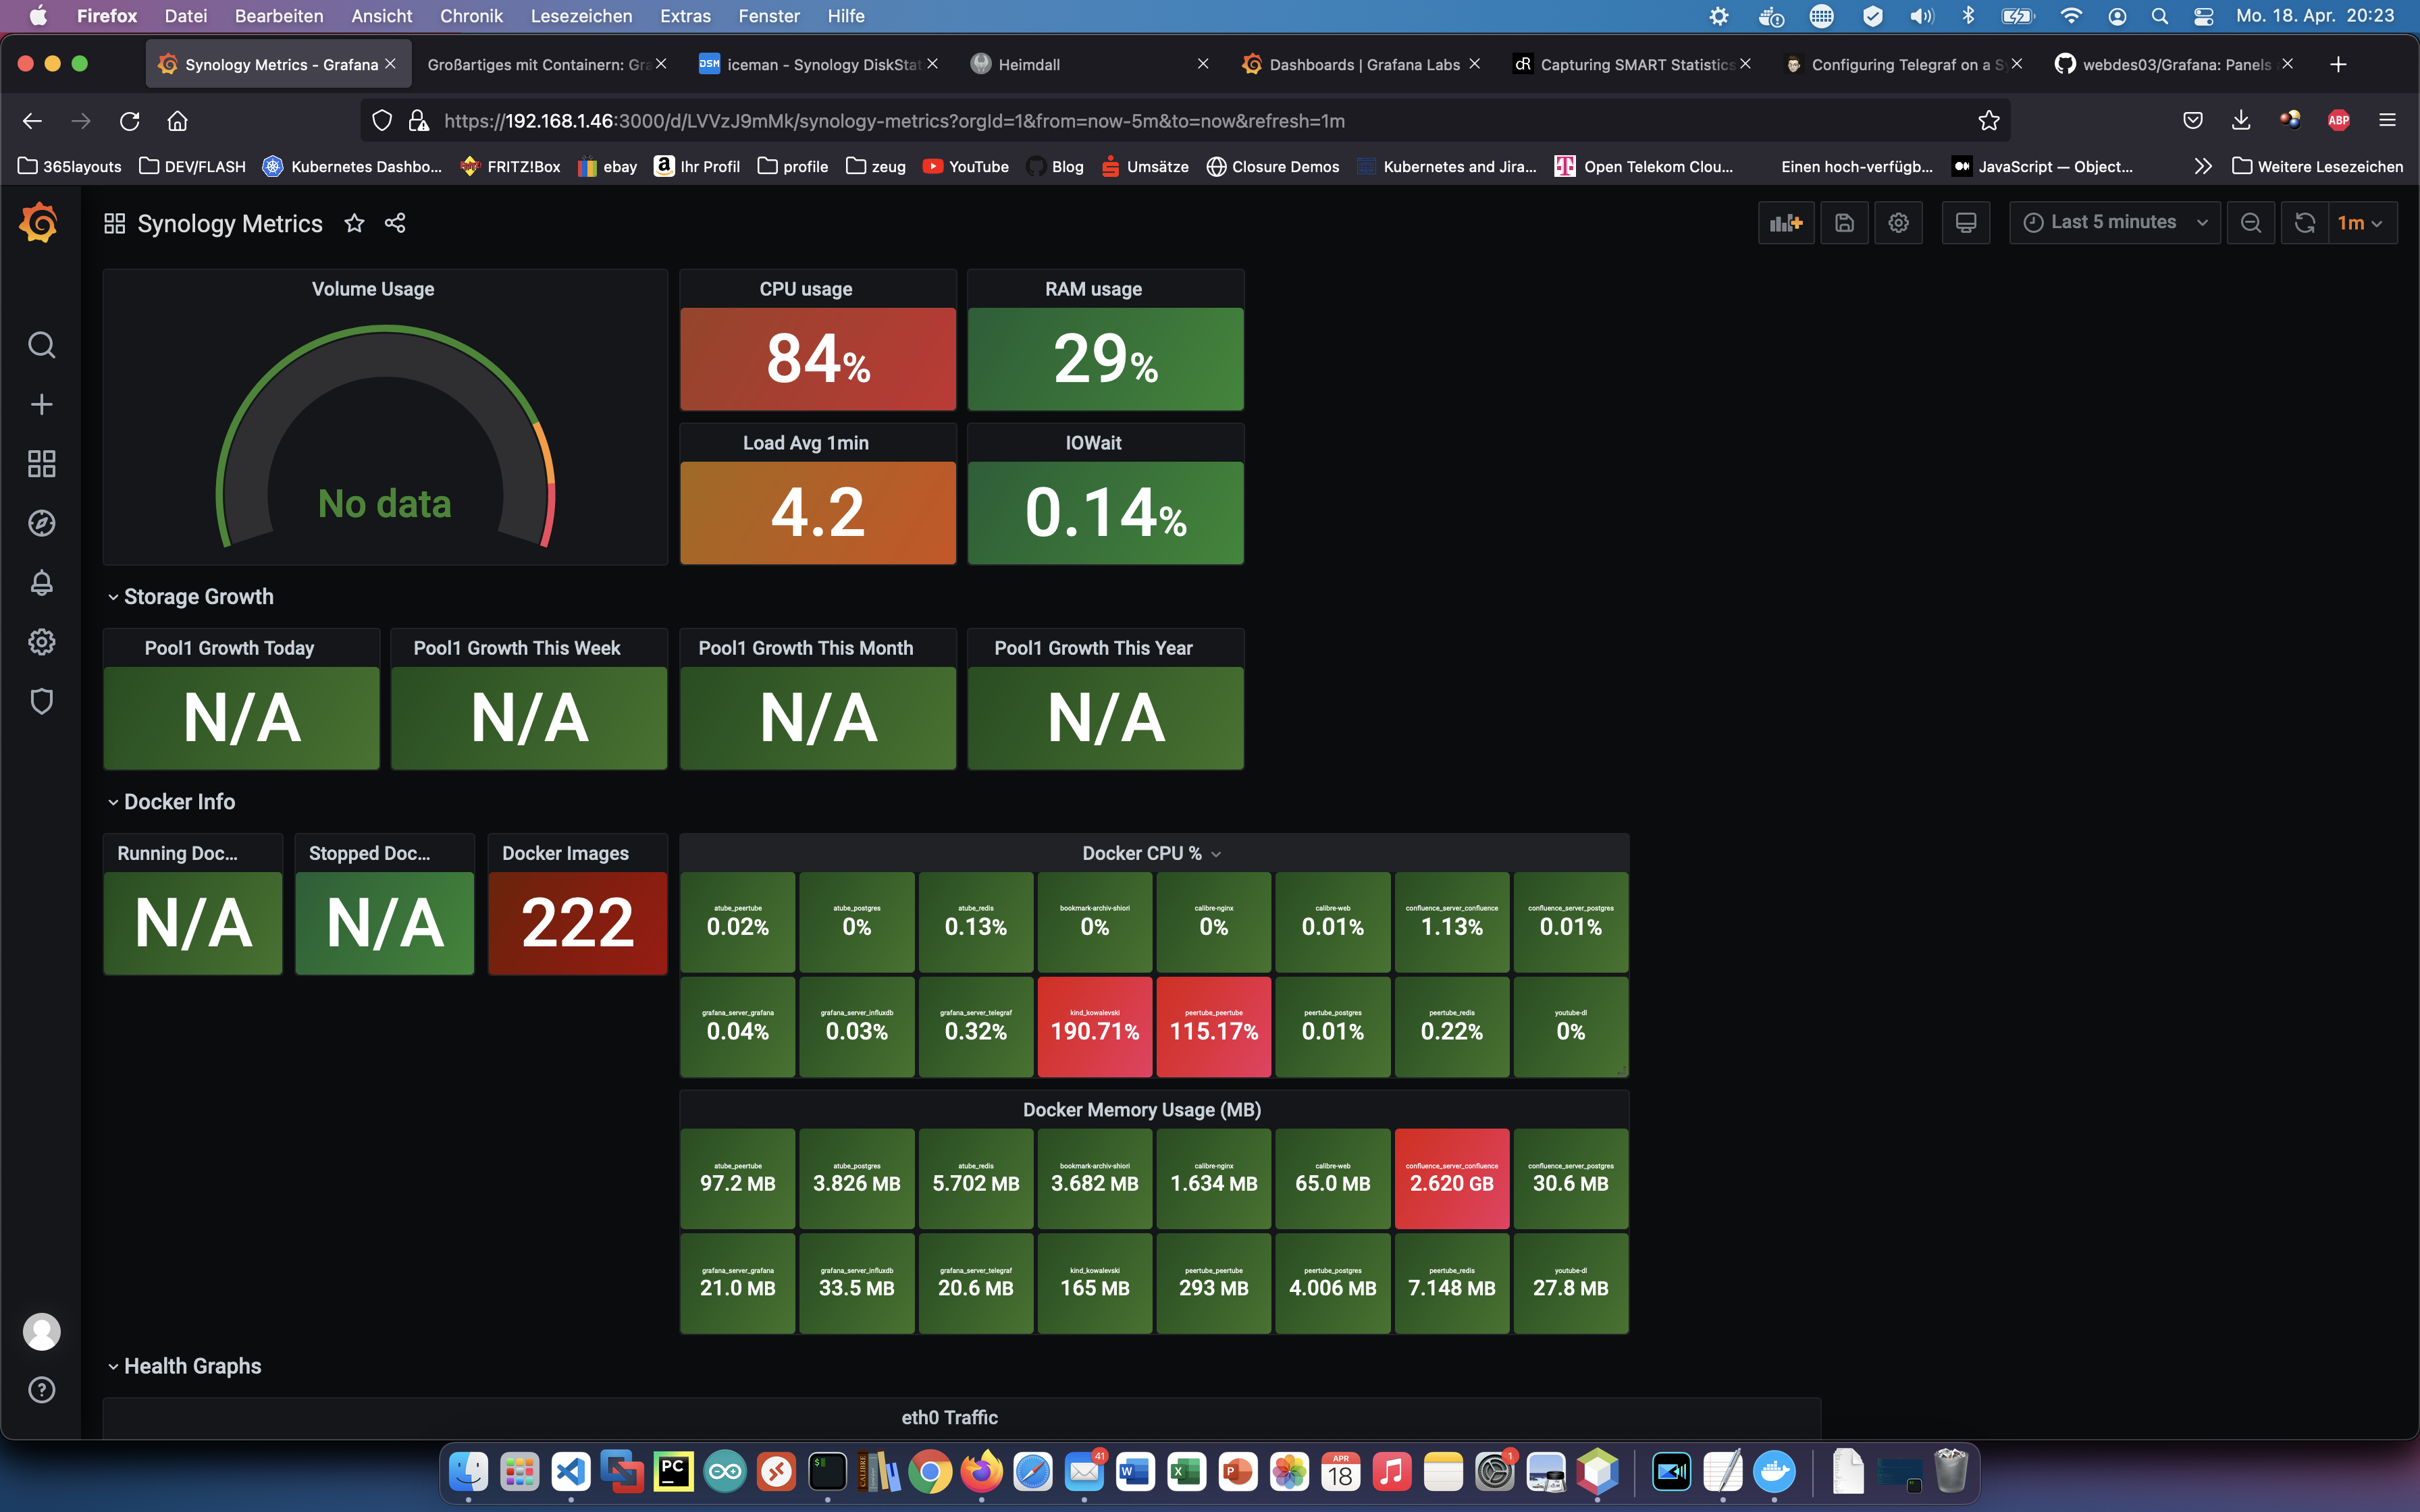
Étape 3 : Configuration
Je peux maintenant appeler le serveur, configurer la base de données, créer un tableau de bord et connecter d’autres données de mesure.