Grafana, InfluxDB, MySQL, PostgreSQL veya Prometheus gibi çeşitli veri kaynaklarından gelen verileri grafiksel olarak görüntülemek için platformlar arası açık kaynaklı bir uygulamadır. Bugün Synology DiskStation üzerinde bir Grafana hizmetinin nasıl kurulacağını gösteriyorum.
Adım 1: Synology’yi Hazırlayın
İlk olarak, DiskStation üzerinde SSH oturum açma etkinleştirilmelidir. Bunu yapmak için, “Denetim Masası” > “Terminal
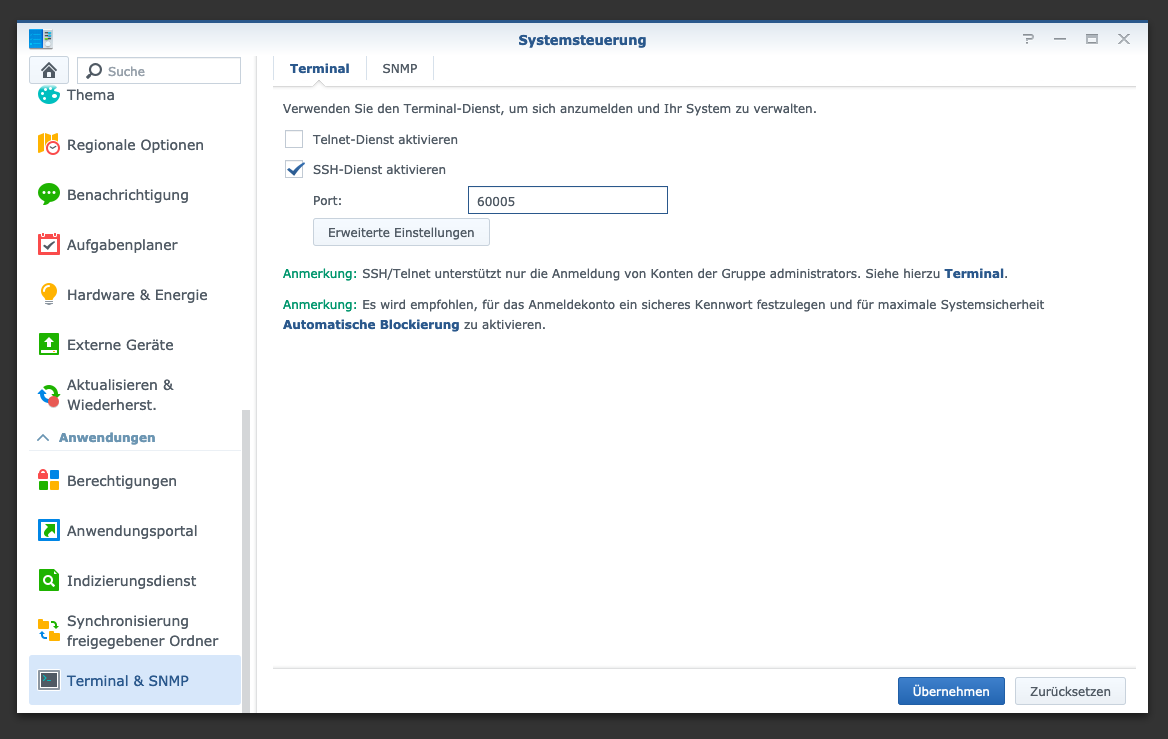
Ardından “SSH”, belirtilen bağlantı noktası ve yönetici parolası ile oturum açabilirsiniz (Windows kullanıcıları Putty veya WinSCP kullanır).
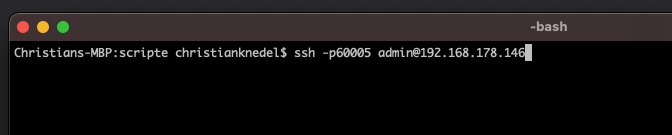
Terminal, winSCP veya Putty ile oturum açıyorum ve bu konsolu daha sonra kullanmak üzere açık bırakıyorum.
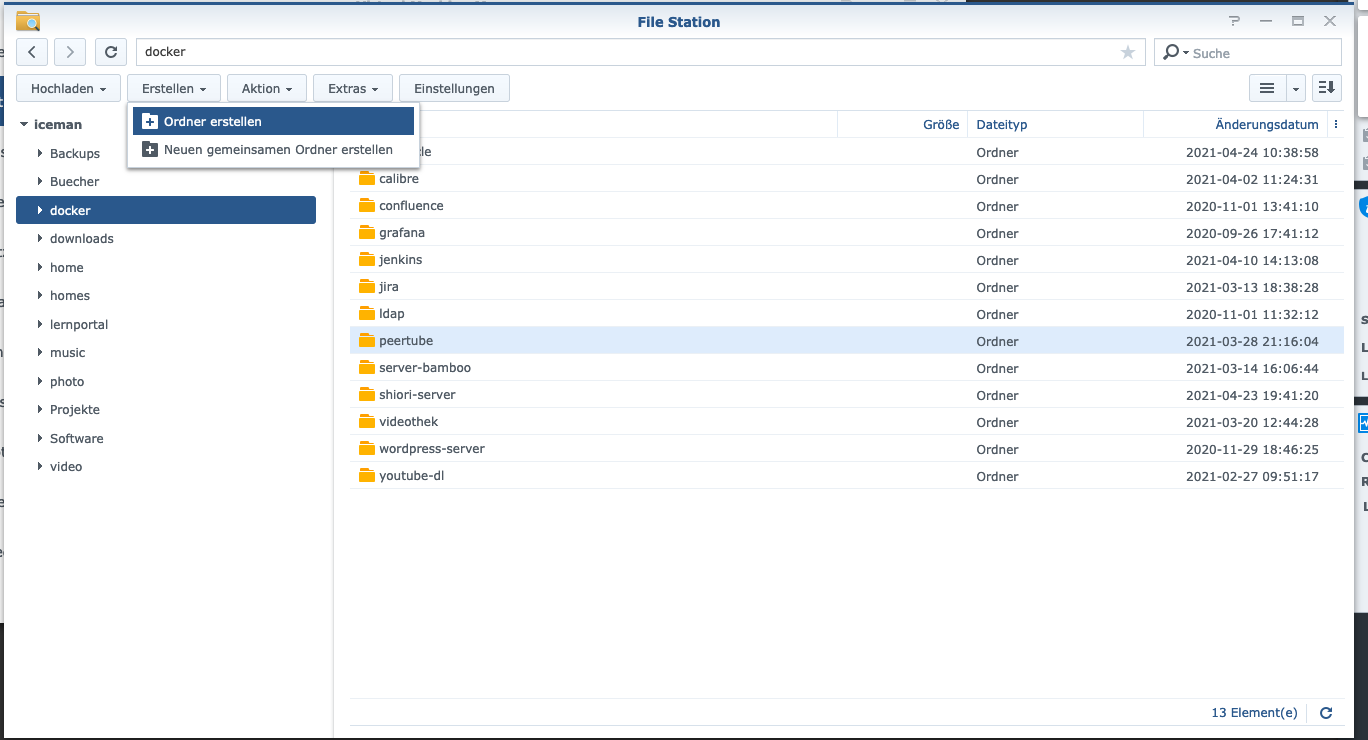
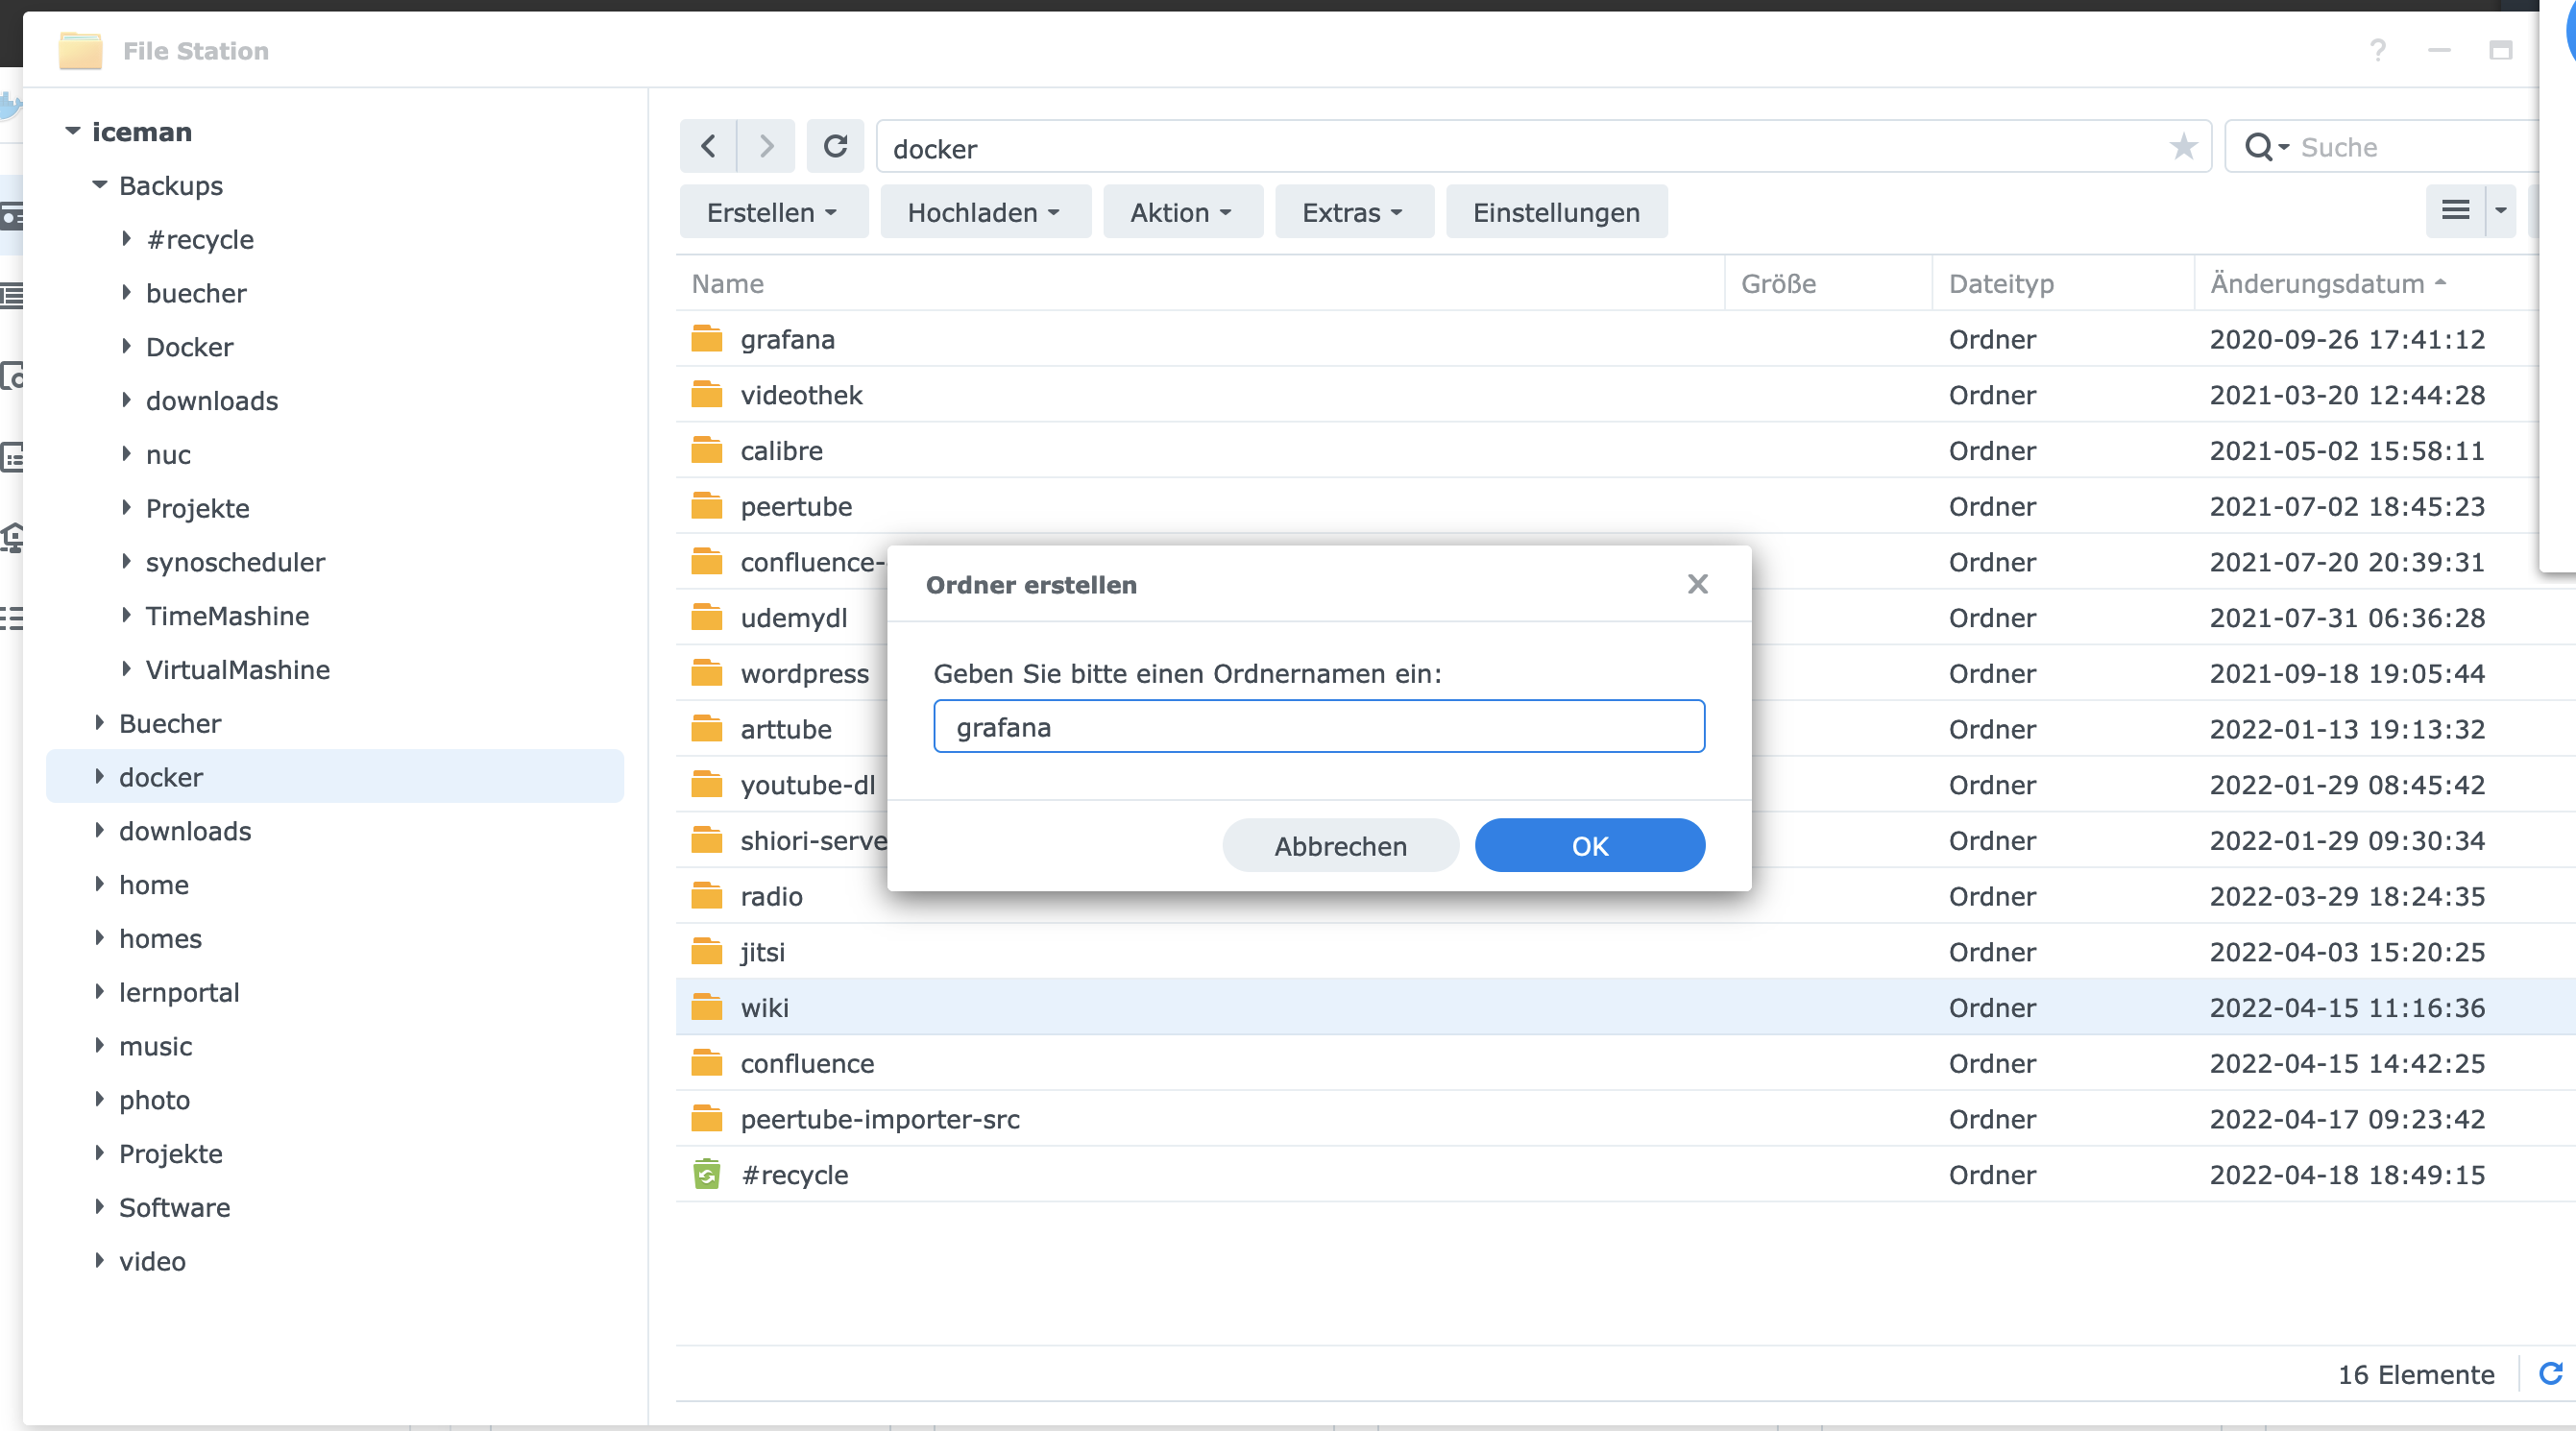
Adım 2: Grafana klasörü oluşturun
Docker dizininde “grafana” adında yeni bir dizin oluşturuyorum.
“cd” komutu ile Grafana dizinini arıyorum:
$ cd /volume1/docker/grafana/
version: "2"
services:
  grafana:
    image: grafana/grafana
    container_name: grafana_server_grafana
    restart: always
    ports:
      - 3000:3000
    networks:
      - grafana
    environment:
      - GF_SERVER_CERT_FILE=/etc/ssl/server.crt
      - GF_SERVER_CERT_KEY=/etc/ssl/server.key
      - GF_SERVER_PROTOCOL=https
      - GF_SERVER_HTTP_PORT=3000
    volumes:
      - ./grafana:/var/lib/grafana
      - ./ssl:/etc/ssl

  influxdb:
    image: influxdb
    container_name: grafana_server_influxdb
    restart: always
    ports:
      - 8086:8086
    networks:
      - grafana
    volumes:
      - ./influxdb:/var/lib/influxdb
      - ./ssl:/etc/ssl
    environment:
      - INFLUXDB_DB=telegraf
      - INFLUXDB_USER=telegraf
      - INFLUXDB_USER_PASSWORD=influxdb-password
      - INFLUXDB_ADMIN_ENABLED=true
      - INFLUXDB_ADMIN_USER=admin
      - INFLUXDB_ADMIN_PASSWORD=influxdb-password
      - INFLUXDB_HTTP_HTTPS_ENABLED=true
      - INFLUXDB_HTTP_HTTPS_CERTIFICATE=/etc/ssl/server.crt
      - INFLUXDB_HTTP_HTTPS_PRIVATE_KEY=/etc/ssl/server.key
      - INFLUXDB_HTTP_AUTH_ENABLED=true

  telegraf:
    image: telegraf
    container_name: grafana_server_telegraf
    restart: always
    environment:
      HOST_PROC: /rootfs/proc
      HOST_SYS: /rootfs/sys
      HOST_ETC: /rootfs/etc
    volumes:
     - ./telegraf.conf:/etc/telegraf/telegraf.conf:ro
     - /var/run/docker.sock:/var/run/docker.sock:ro
     - /sys:/rootfs/sys:ro
     - /proc:/rootfs/proc:ro
     - /etc:/rootfs/etc:ro

networks:
  grafana:
Veriler için iki alt klasör daha oluşturuyorum:
$ mkdir grafana
$ mkdir influxdb
$ chown -R 472:472 grafana
$ mkdir ssl
$ openssl genrsa -aes256 -passout pass:your-password -out ssl/server.pass.key 4096
$ openssl rsa -passin pass:your-password -in ssl/server.pass.key -out ssl/server.key
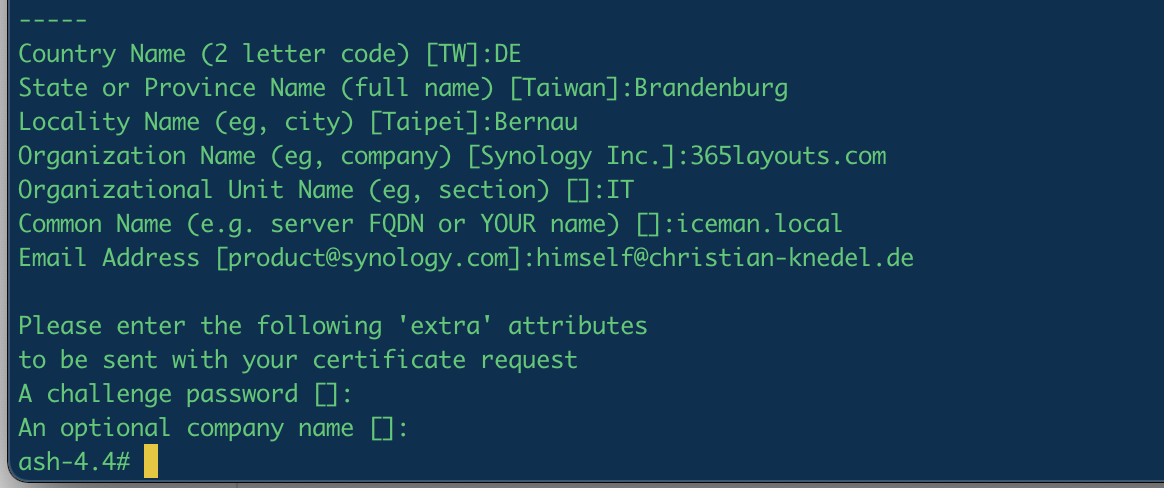
$ openssl req -new -key ssl/server.key -out ssl/server.csr
$ rm ssl/server.pass.key
$ openssl x509 -req -sha256 -days 365 -in ssl/server.csr -signkey ssl/server.key -out ssl/server.crt
Son olarak, bu içeriğe sahip bir “telegraf.conf” dosyası oluşturuyorum:
[global_tags]

[agent]
  interval = "60s"
  round_interval = true
  metric_batch_size = 1000
  metric_buffer_limit = 10000
  collection_jitter = "0s"
  flush_interval = "10s"
  flush_jitter = "0s"
  precision = ""
  hostname = "Synology DS918"
  omit_hostname = false

[[outputs.influxdb]]
urls = ["https://192.168.1.46:8086"] #synology ip
database = "telegraf"
timeout = "5s"
username = "telegraf"
password = "influxdb-password"
insecure_skip_verify = true

[[inputs.ping]]
  interval = "5s"
  urls = ["google.com", "amazon.com", "github.com"]
  count = 4
  ping_interval = 1.0
  timeout = 2.0

[[inputs.cpu]]
  percpu = true
  totalcpu = true
  collect_cpu_time = false
  report_active = false
  fielddrop = ["time_*"]

[[inputs.disk]]
  ignore_fs = ["tmpfs", "devtmpfs", "devfs", "iso9660", "overlay", "aufs", "squashfs"]

[[inputs.disk]]
  ignore_fs = ["tmpfs", "devtmpfs", "none", "iso9660", "overlay", "aufs", "squashfs"]

[[inputs.diskio]]

[[inputs.kernel]]

[[inputs.mem]]

[[inputs.swap]]

[[inputs.net]]
  fieldpass = [ "bytes*" ]

[[inputs.netstat]]

[[inputs.processes]]

[[inputs.system]]

[[inputs.net]]
  fieldpass = [ "bytes*" ]

[[inputs.docker]]
  endpoint = "unix:///var/run/docker.sock"

  gather_services = false

  container_name_include = []
  container_name_exclude = []

  timeout = "5s"

  docker_label_include = []
  docker_label_exclude = []

  perdevice = true

  total = false


##

## Synology

##
 [[inputs.snmp]]
   # List of agents to poll
   agents = [ "192.168.1.46" ] # required - enter the IP address of your Synology device

   # Polling interval
   interval = "60s"

   # Timeout for each SNMP query.
   timeout = "10s"

   # Number of retries to attempt within timeout.
   retries = 3

   # SNMP version, UAP only supports v1
   version = 2

   # SNMP community string.
   community = "public"

   # The GETBULK max-repetitions parameter
   max_repetitions = 30

   # Measurement name
   name = "snmp.SYNO"

   #  System name (hostname)
   [[inputs.snmp.field]]
     is_tag = true
     name = "sysName"
     oid = "RFC1213-MIB::sysName.0"
   #  System vendor OID
   [[inputs.snmp.field]]
     name = "sysObjectID"
     oid = "RFC1213-MIB::sysObjectID.0"
   #  System description
   [[inputs.snmp.field]]
     name = "sysDescr"
     oid = "RFC1213-MIB::sysDescr.0"
   #  System contact
   [[inputs.snmp.field]]
     name = "sysContact"
     oid = "RFC1213-MIB::sysContact.0"
   #  System location
   [[inputs.snmp.field]]
     name = "sysLocation"
     oid = "RFC1213-MIB::sysLocation.0"
   #  System uptime
   [[inputs.snmp.field]]
     name = "sysUpTime"
     oid = "RFC1213-MIB::sysUpTime.0"
   # Inet interface
   [[inputs.snmp.table]]
     oid = "IF-MIB::ifTable"
     [[inputs.snmp.table.field]]
       is_tag = true
     oid = "IF-MIB::ifDescr"
   #Syno disk
   [[inputs.snmp.table]]
     oid = "SYNOLOGY-DISK-MIB::diskTable"
     [[inputs.snmp.table.field]]
       is_tag = true
     oid = "SYNOLOGY-DISK-MIB::diskID"
   #Syno raid
   [[inputs.snmp.table]]
     oid = "SYNOLOGY-RAID-MIB::raidTable"
     [[inputs.snmp.table.field]]
       is_tag = true
     oid = "SYNOLOGY-RAID-MIB::raidName"
   #Syno load
   [[inputs.snmp.table]]
     oid = "UCD-SNMP-MIB::laTable"
     [[inputs.snmp.table.field]]
       is_tag = true
     oid = "UCD-SNMP-MIB::laNames"
   #  System memTotalSwap
   [[inputs.snmp.field]]
     name = "memTotalSwap"
     oid = "UCD-SNMP-MIB::memTotalSwap.0"
   #  System memAvailSwap
   [[inputs.snmp.field]]
     name = "memAvailSwap"
     oid = "UCD-SNMP-MIB::memAvailSwap.0"
   #  System memTotalReal
   [[inputs.snmp.field]]
     name = "memTotalReal"
     oid = "UCD-SNMP-MIB::memTotalReal.0"
   #  System memAvailReal
   [[inputs.snmp.field]]
     name = "memAvailReal"
     oid = "UCD-SNMP-MIB::memAvailReal.0"
   #  System memTotalFree
   [[inputs.snmp.field]]
     name = "memTotalFree"
     oid = "UCD-SNMP-MIB::memTotalFree.0"
   #  System Status
   [[inputs.snmp.field]]
     name = "systemStatus"
     oid = "SYNOLOGY-SYSTEM-MIB::systemStatus.0"
   #  System temperature
   [[inputs.snmp.field]]
     name = "temperature"
     oid = "SYNOLOGY-SYSTEM-MIB::temperature.0"
   #  System powerStatus
   [[inputs.snmp.field]]
     name = "powerStatus"
     oid = "SYNOLOGY-SYSTEM-MIB::powerStatus.0"
   #  System systemFanStatus
   [[inputs.snmp.field]]
     name = "systemFanStatus"
     oid = "SYNOLOGY-SYSTEM-MIB::systemFanStatus.0"
   #  System cpuFanStatus
   [[inputs.snmp.field]]
     name = "cpuFanStatus"
     oid = "SYNOLOGY-SYSTEM-MIB::cpuFanStatus.0"
   #  System modelName
   [[inputs.snmp.field]]
     name = "modelName"
     oid = "SYNOLOGY-SYSTEM-MIB::modelName.0"
   #  System serialNumber
   [[inputs.snmp.field]]
     name = "serialNumber"
     oid = "SYNOLOGY-SYSTEM-MIB::serialNumber.0"
   #  System version
   [[inputs.snmp.field]]
     name = "version"
     oid = "SYNOLOGY-SYSTEM-MIB::version.0"
   #  System upgradeAvailable
   [[inputs.snmp.field]]
     name = "upgradeAvailable"
     oid = "SYNOLOGY-SYSTEM-MIB::upgradeAvailable.0"
   # System volume
   [[inputs.snmp.table]]
     oid = "HOST-RESOURCES-MIB::hrStorageTable"
   [[inputs.snmp.table.field]]
       is_tag = true
     oid = "HOST-RESOURCES-MIB::hrStorageDescr"
   # System ssCpuUser
   [[inputs.snmp.field]]
     name = "ssCpuUser"
     oid = ".1.3.6.1.4.1.2021.11.9.0"
   # System ssCpuSystem
   [[inputs.snmp.field]]
     name = "ssCpuSystem"
     oid = ".1.3.6.1.4.1.2021.11.10.0"
   # System ssCpuIdle
   [[inputs.snmp.field]]
     name = "ssCpuIdle"
     oid = ".1.3.6.1.4.1.2021.11.11.0"
   # Service users CIFS
   [[inputs.snmp.table.field]]
     name = "usersCIFS"
     oid = "SYNOLOGY-SERVICES-MIB::serviceUsers"
     oid_index_suffix = "1"
   # Service users AFP
   [[inputs.snmp.table.field]]
     name = "usersAFP"
     oid = "SYNOLOGY-SERVICES-MIB::serviceUsers"
     oid_index_suffix = "2"
   # Service users NFS
   [[inputs.snmp.table.field]]
     name = "usersNFS"
     oid = "SYNOLOGY-SERVICES-MIB::serviceUsers"
     oid_index_suffix = "3"
   # Service users FTP
   [[inputs.snmp.table.field]]
     name = "usersFTP"
     oid = "SYNOLOGY-SERVICES-MIB::serviceUsers"
     oid_index_suffix = "4"
   # Service users SFTP
   [[inputs.snmp.table.field]]
     name = "usersSFTP"
     oid = "SYNOLOGY-SERVICES-MIB::serviceUsers"
     oid_index_suffix = "5"
   # Service users HTTP
   [[inputs.snmp.table.field]]
     name = "usersHTTP"
     oid = "SYNOLOGY-SERVICES-MIB::serviceUsers"
     oid_index_suffix = "6"
   # Service users TELNET
   [[inputs.snmp.table.field]]
     name = "usersTELNET"
     oid = "SYNOLOGY-SERVICES-MIB::serviceUsers"
     oid_index_suffix = "7"
   # Service users SSH
   [[inputs.snmp.table.field]]
     name = "usersSSH"
     oid = "SYNOLOGY-SERVICES-MIB::serviceUsers"
     oid_index_suffix = "8"
   # Service users OTHER
   [[inputs.snmp.table.field]]
     name = "usersOTHER"
     oid = "SYNOLOGY-SERVICES-MIB::serviceUsers"
     oid_index_suffix = "9"
   # UPS Status
   [[inputs.snmp.table.field]]
     name = "upsStatus"
     oid = "SYNOLOGY-UPS-MIB::upsInfoStatus"
   # UPS Load
   [[inputs.snmp.table.field]]
     name = "upsLoad"
     oid = "SYNOLOGY-UPS-MIB::upsInfoLoadValue"
   # UPS Battery Charge
   [[inputs.snmp.table.field]]
     name = "upsCharge"
     oid = "SYNOLOGY-UPS-MIB::upsBatteryChargeValue"
   # UPS Battery Charge Warning
   [[inputs.snmp.table.field]]
     name = "upsWarning"
     oid = "SYNOLOGY-UPS-MIB::upsBatteryChargeWarning"

[[inputs.docker]]
  endpoint = "unix:///var/run/docker.sock"

  gather_services = false

  container_name_include = []
  container_name_exclude = []

  timeout = "5s"

  docker_label_include = []
  docker_label_exclude = []

  perdevice = true

  total = false
Şimdi bu Compose çağrısı ile Grafana sunucusunu başlatın:
$ sudo docker-compose -f grafana.yml up
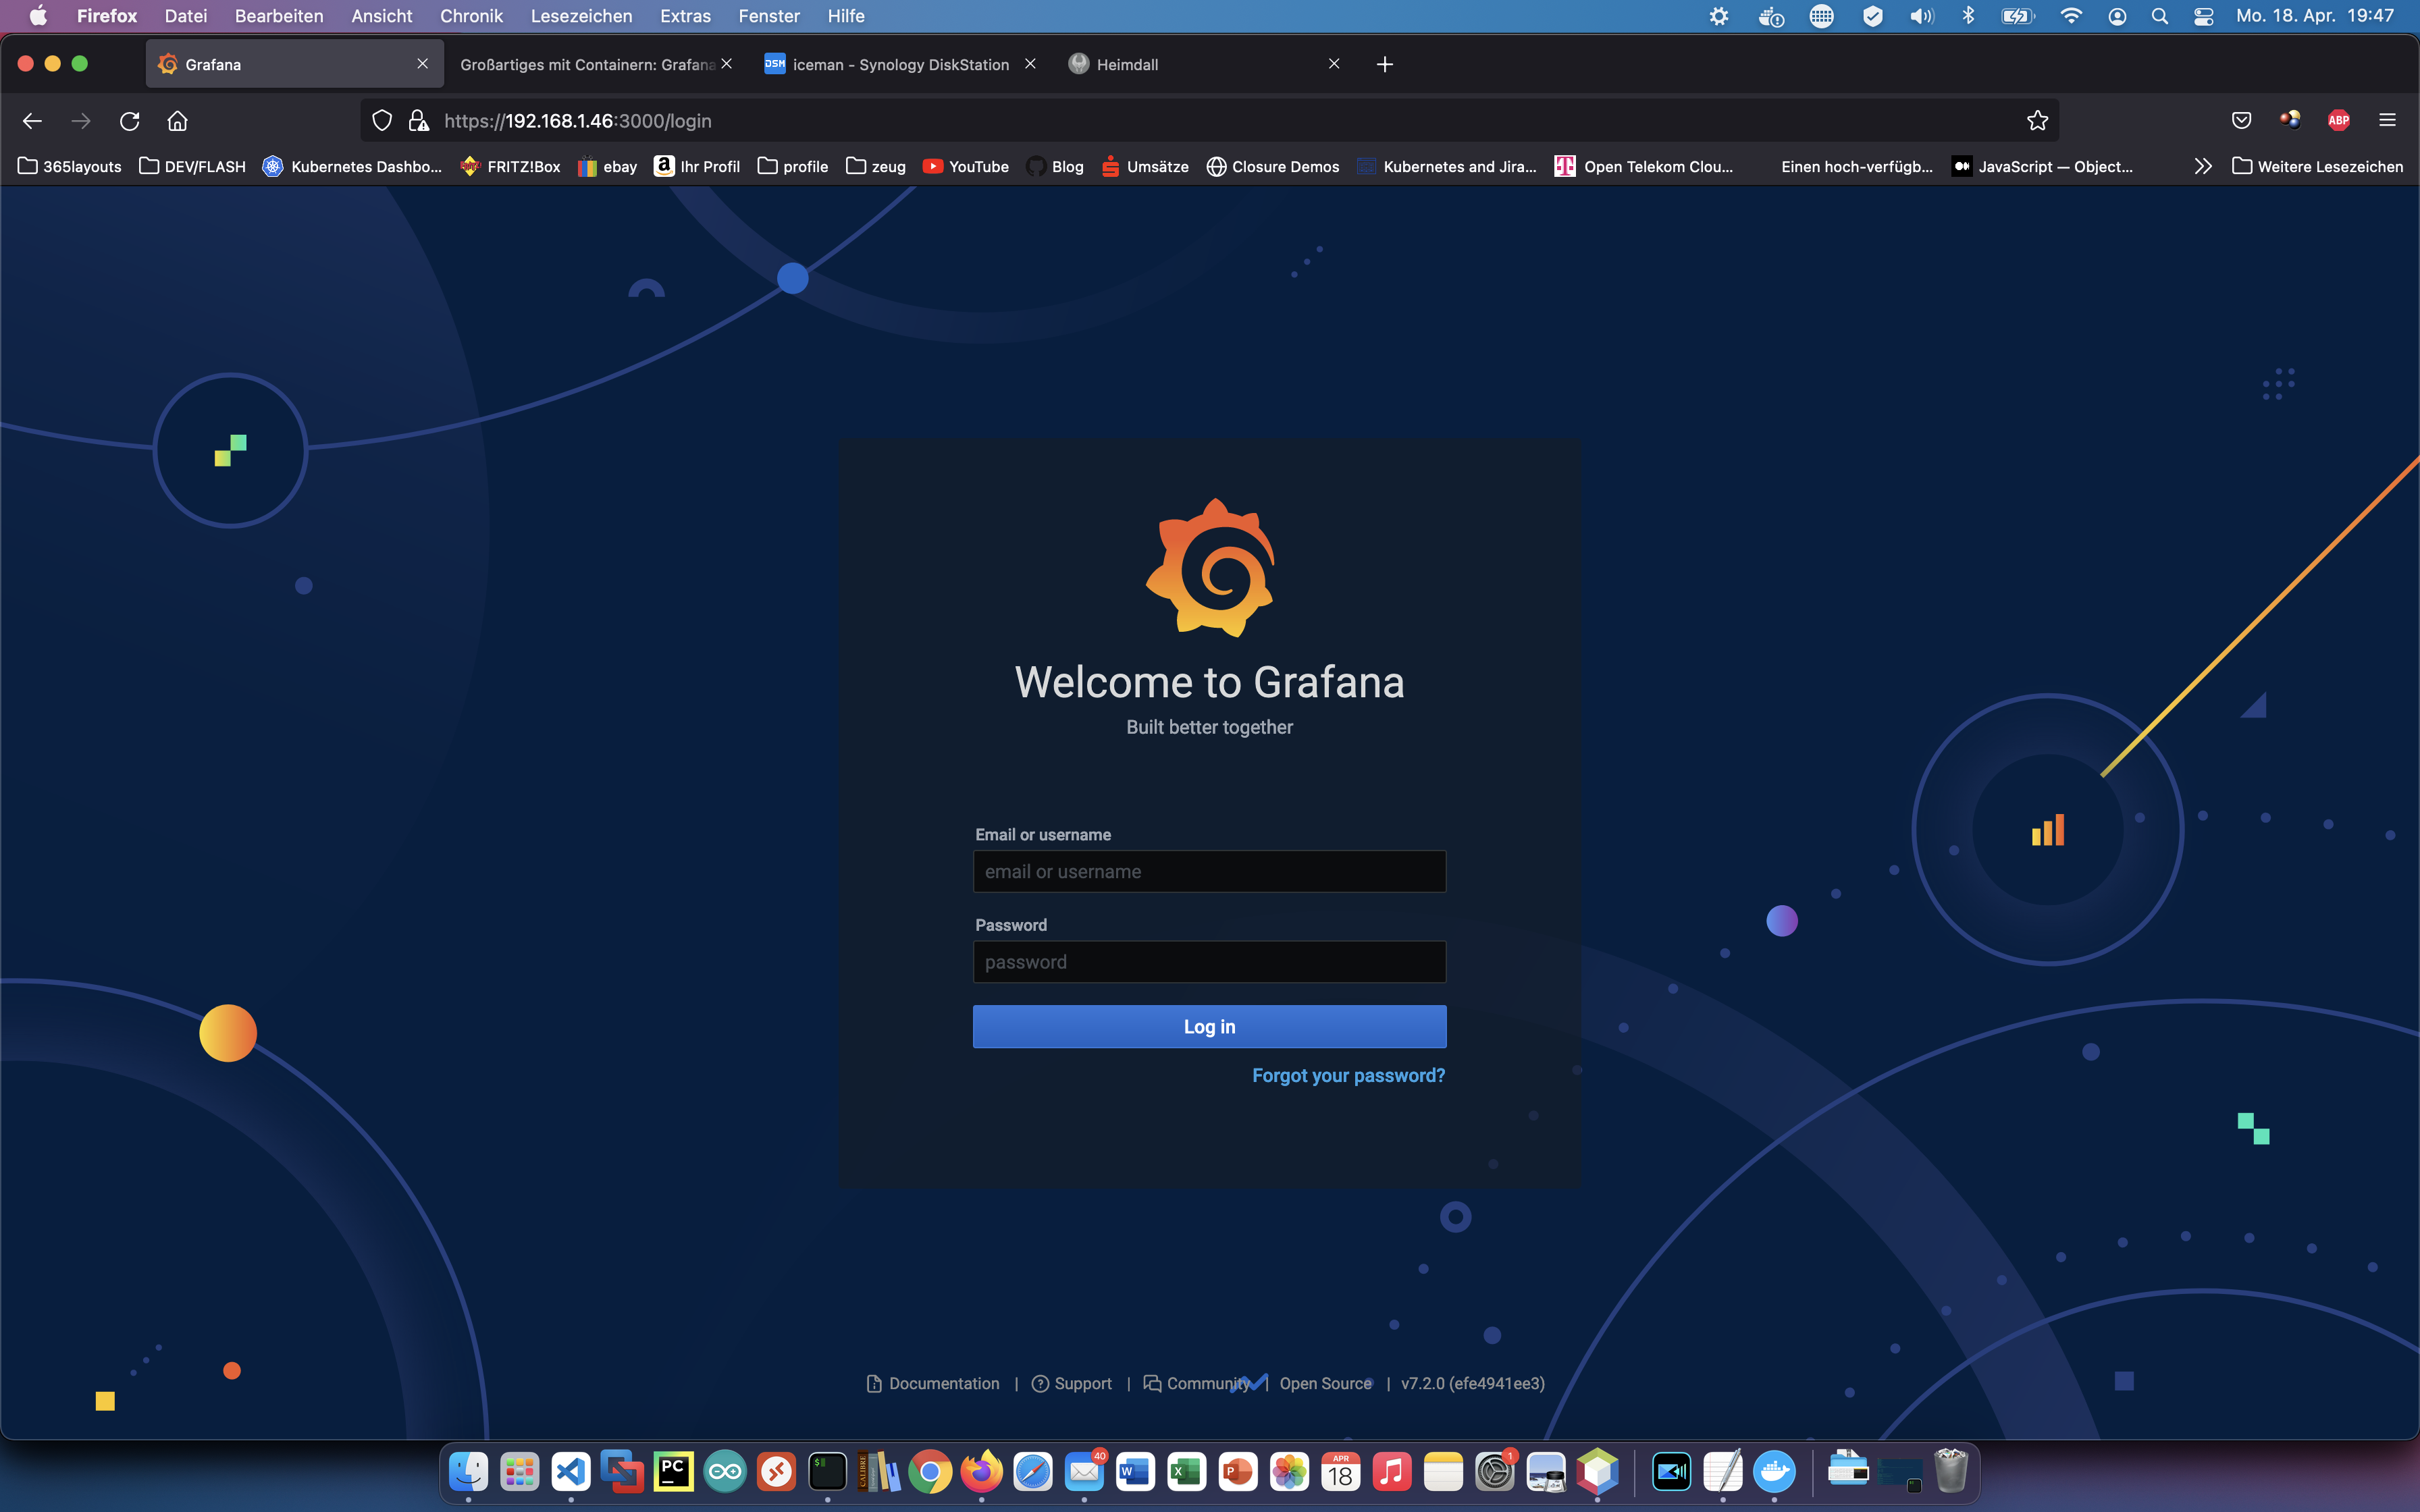
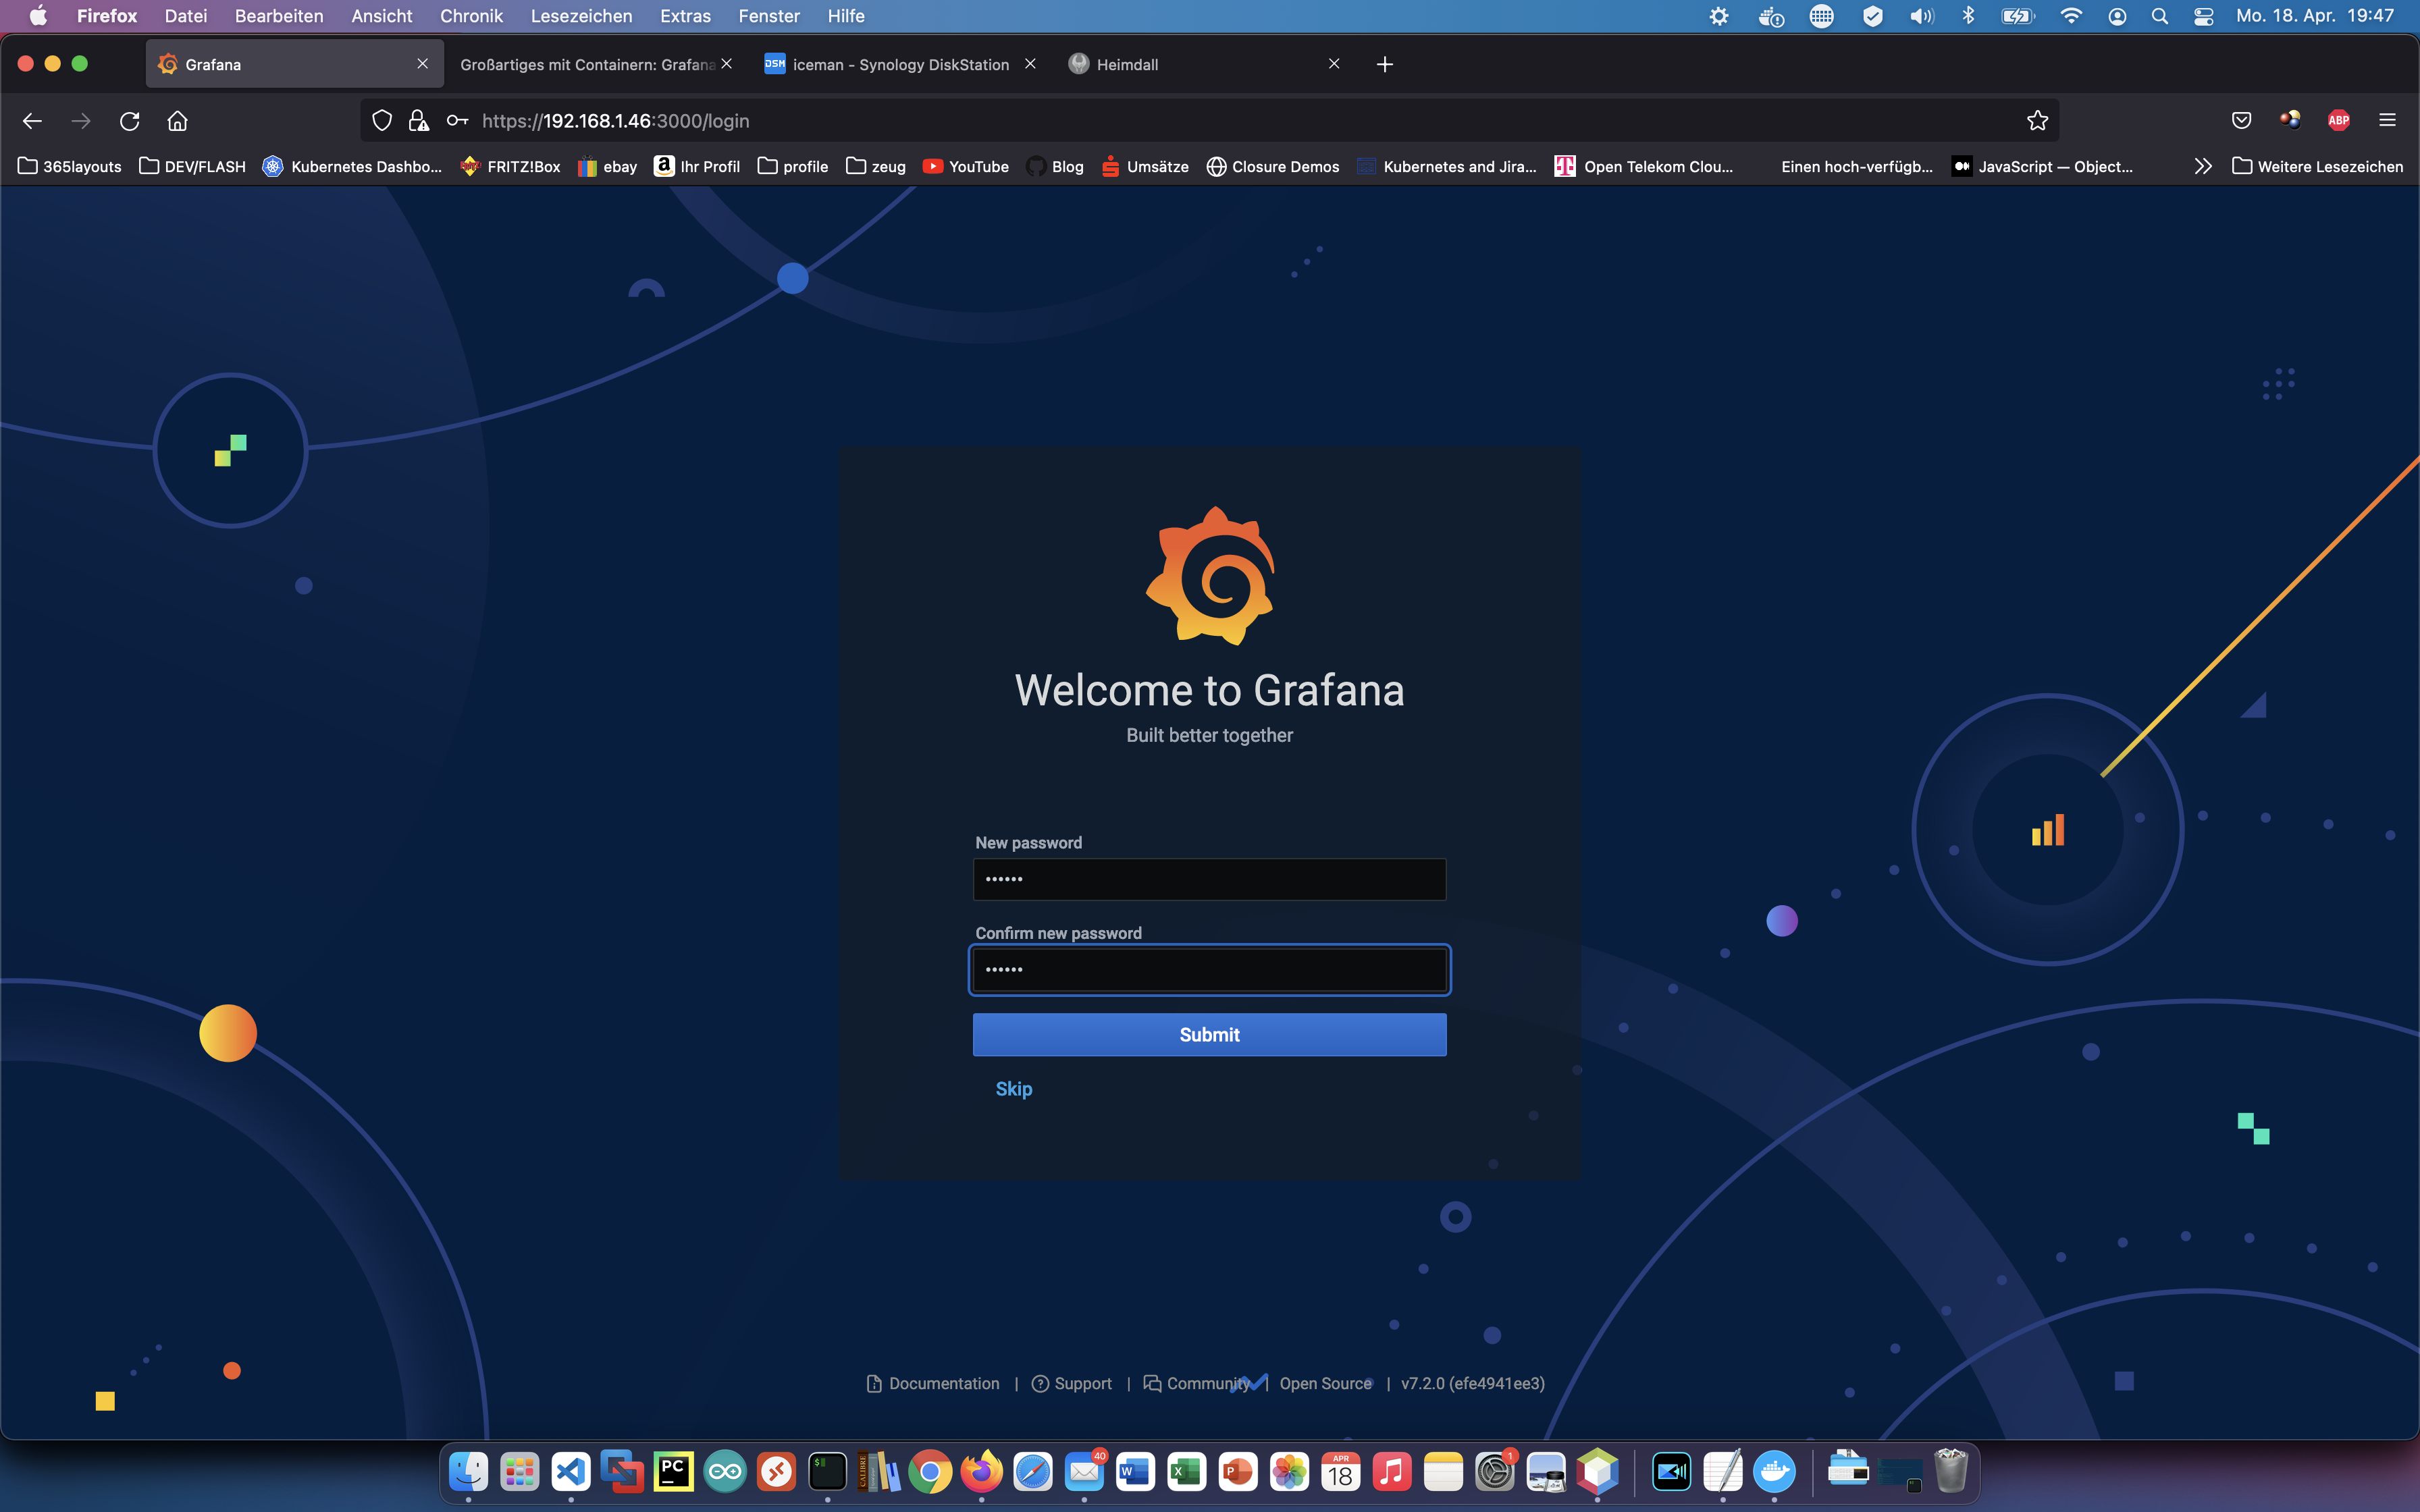
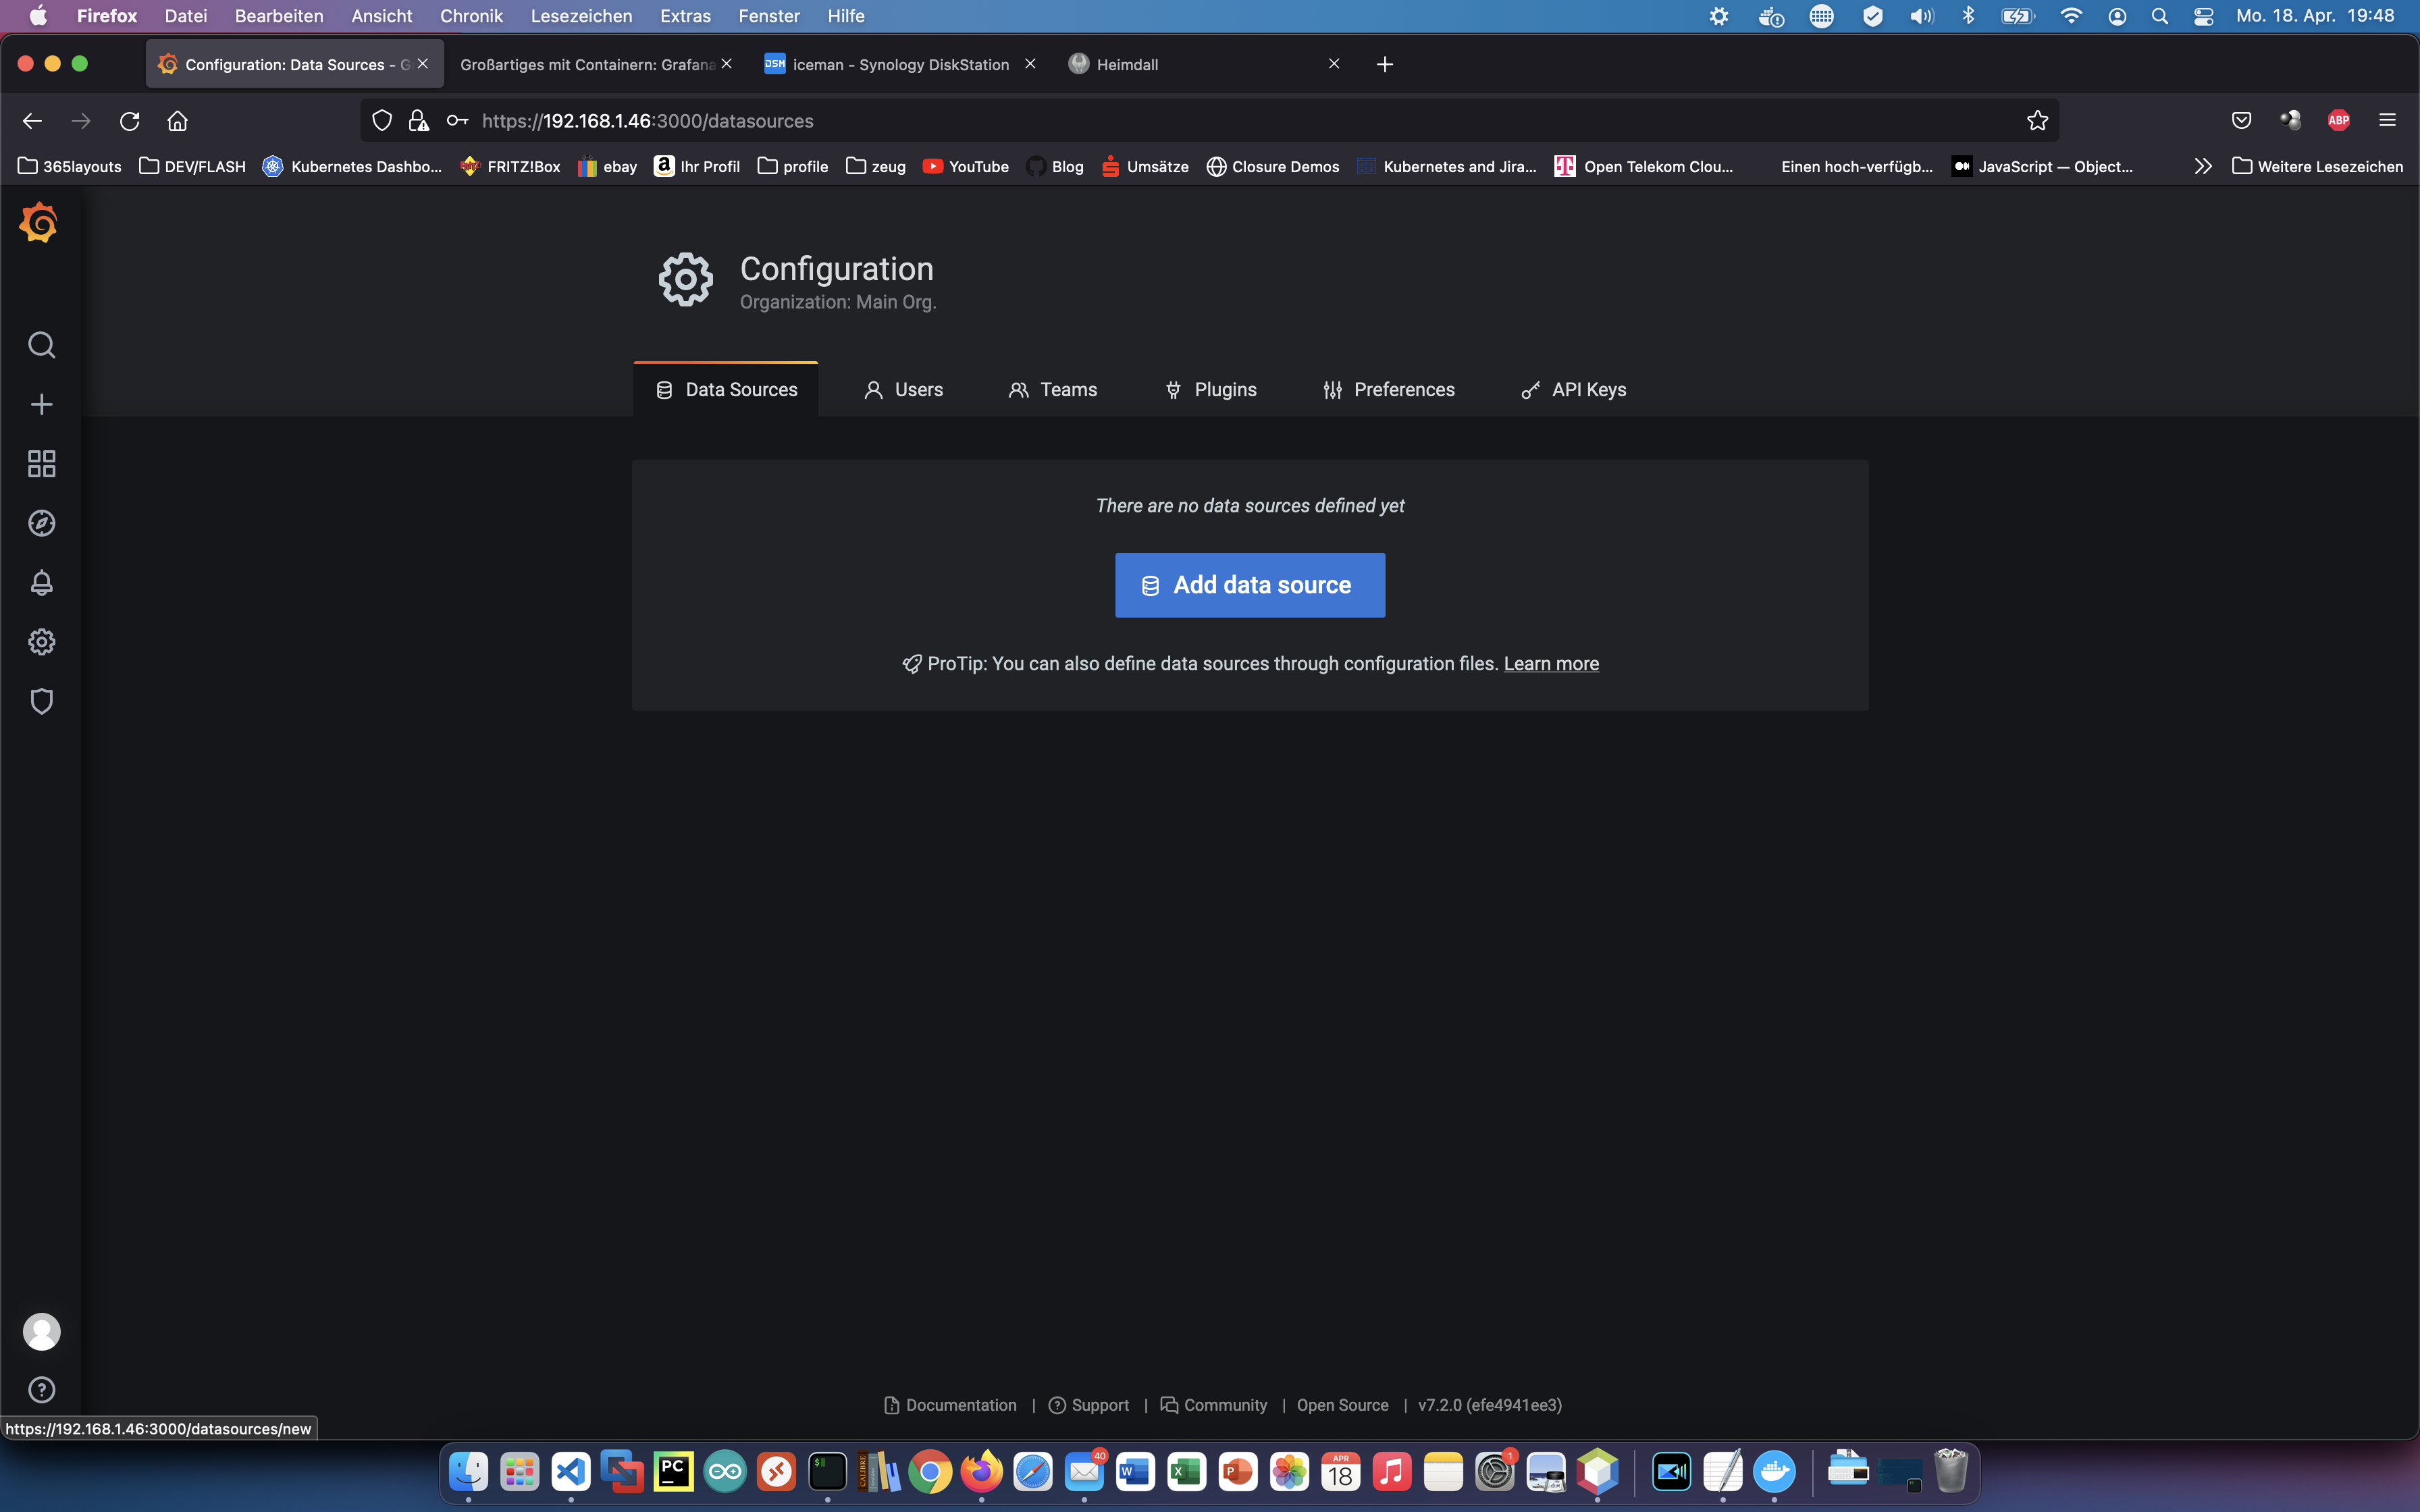
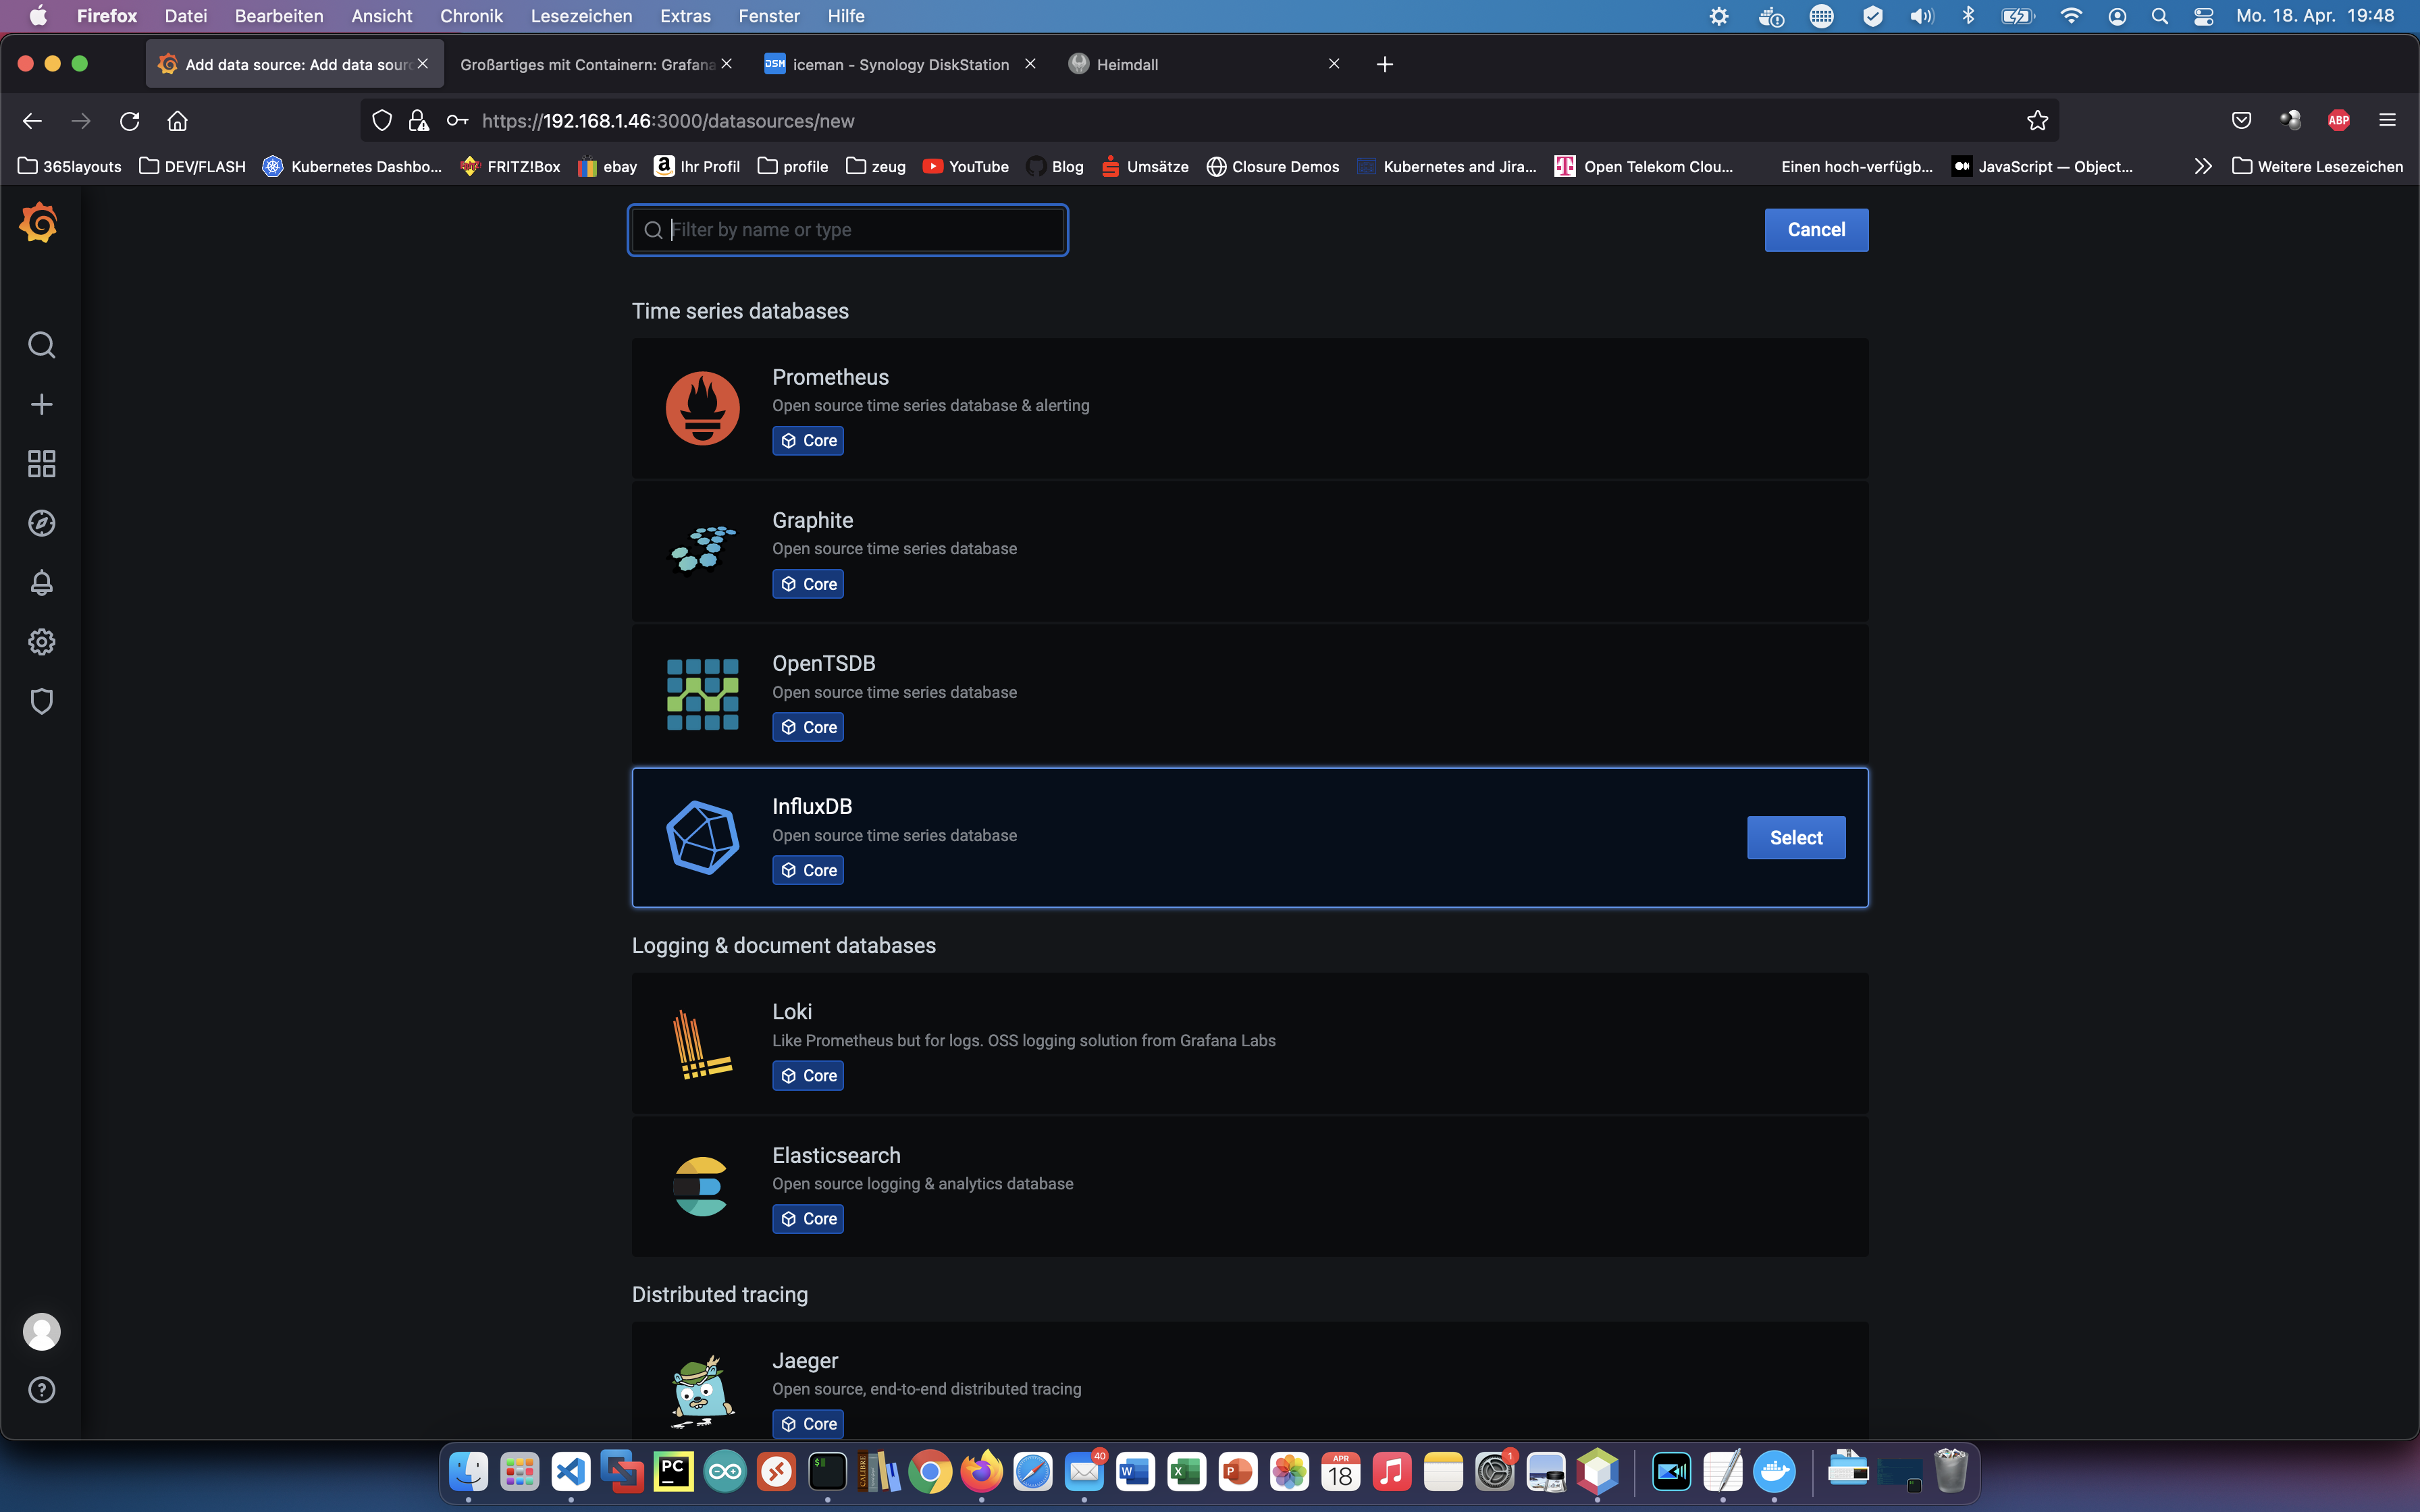
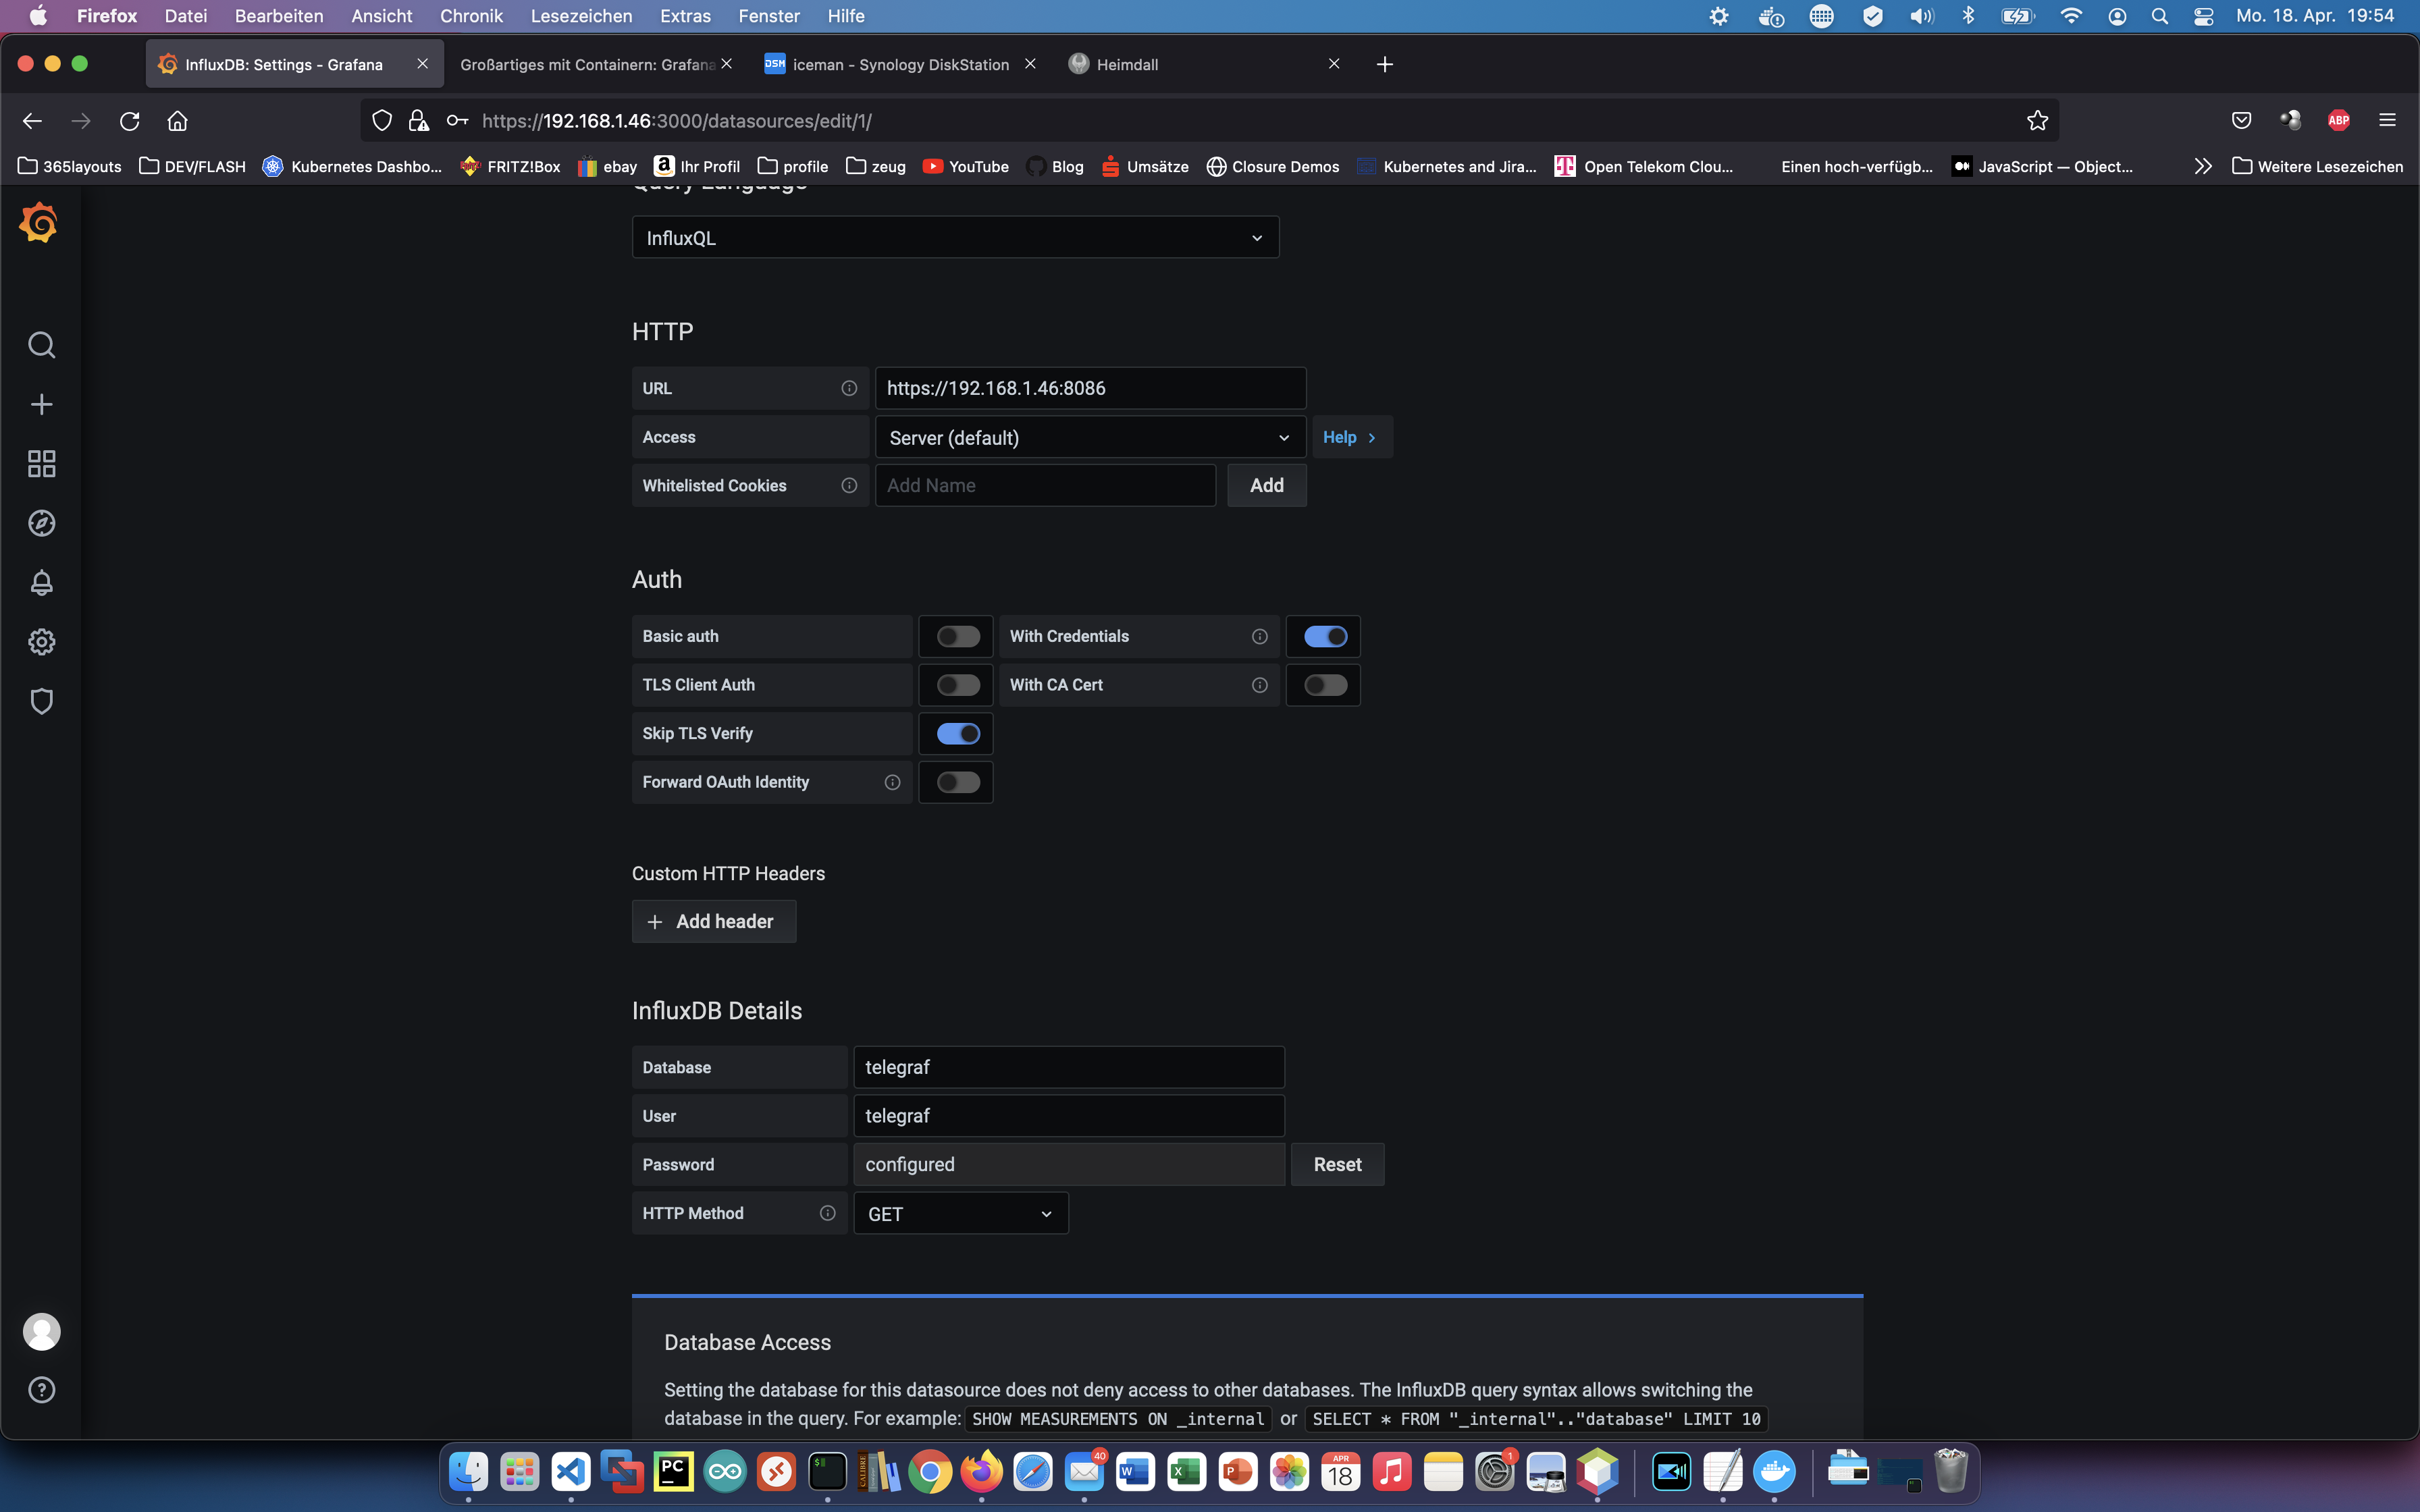
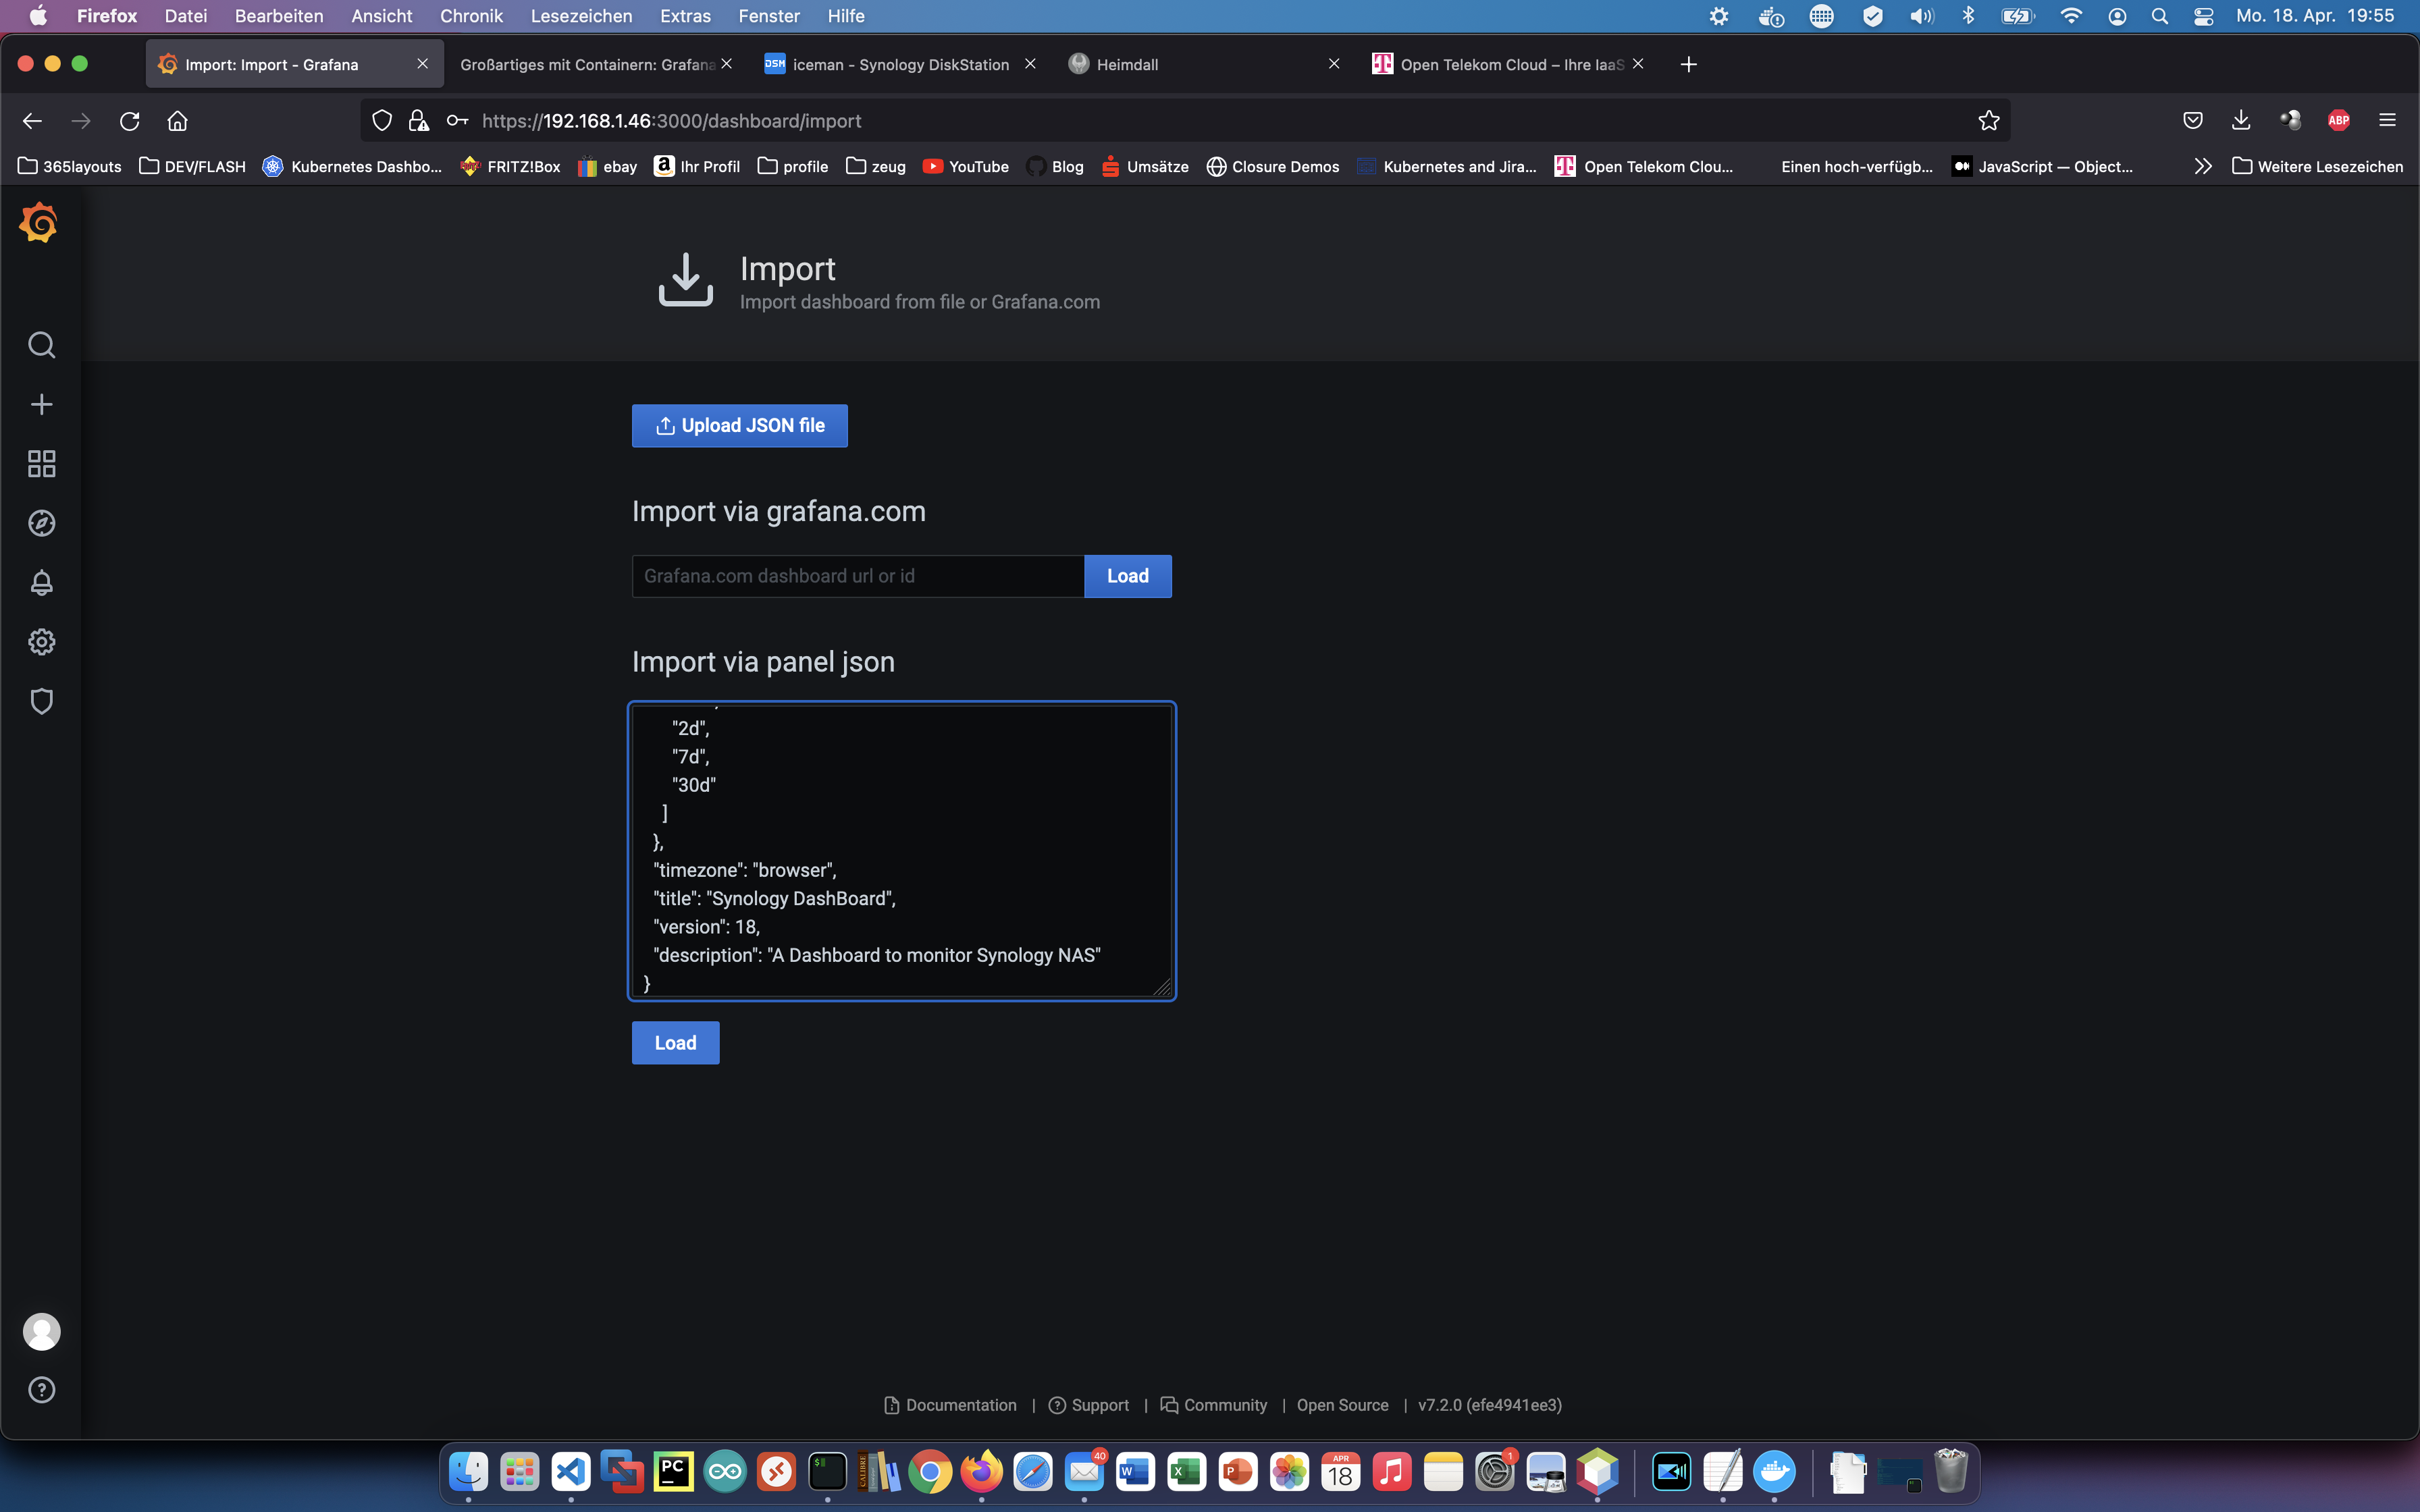
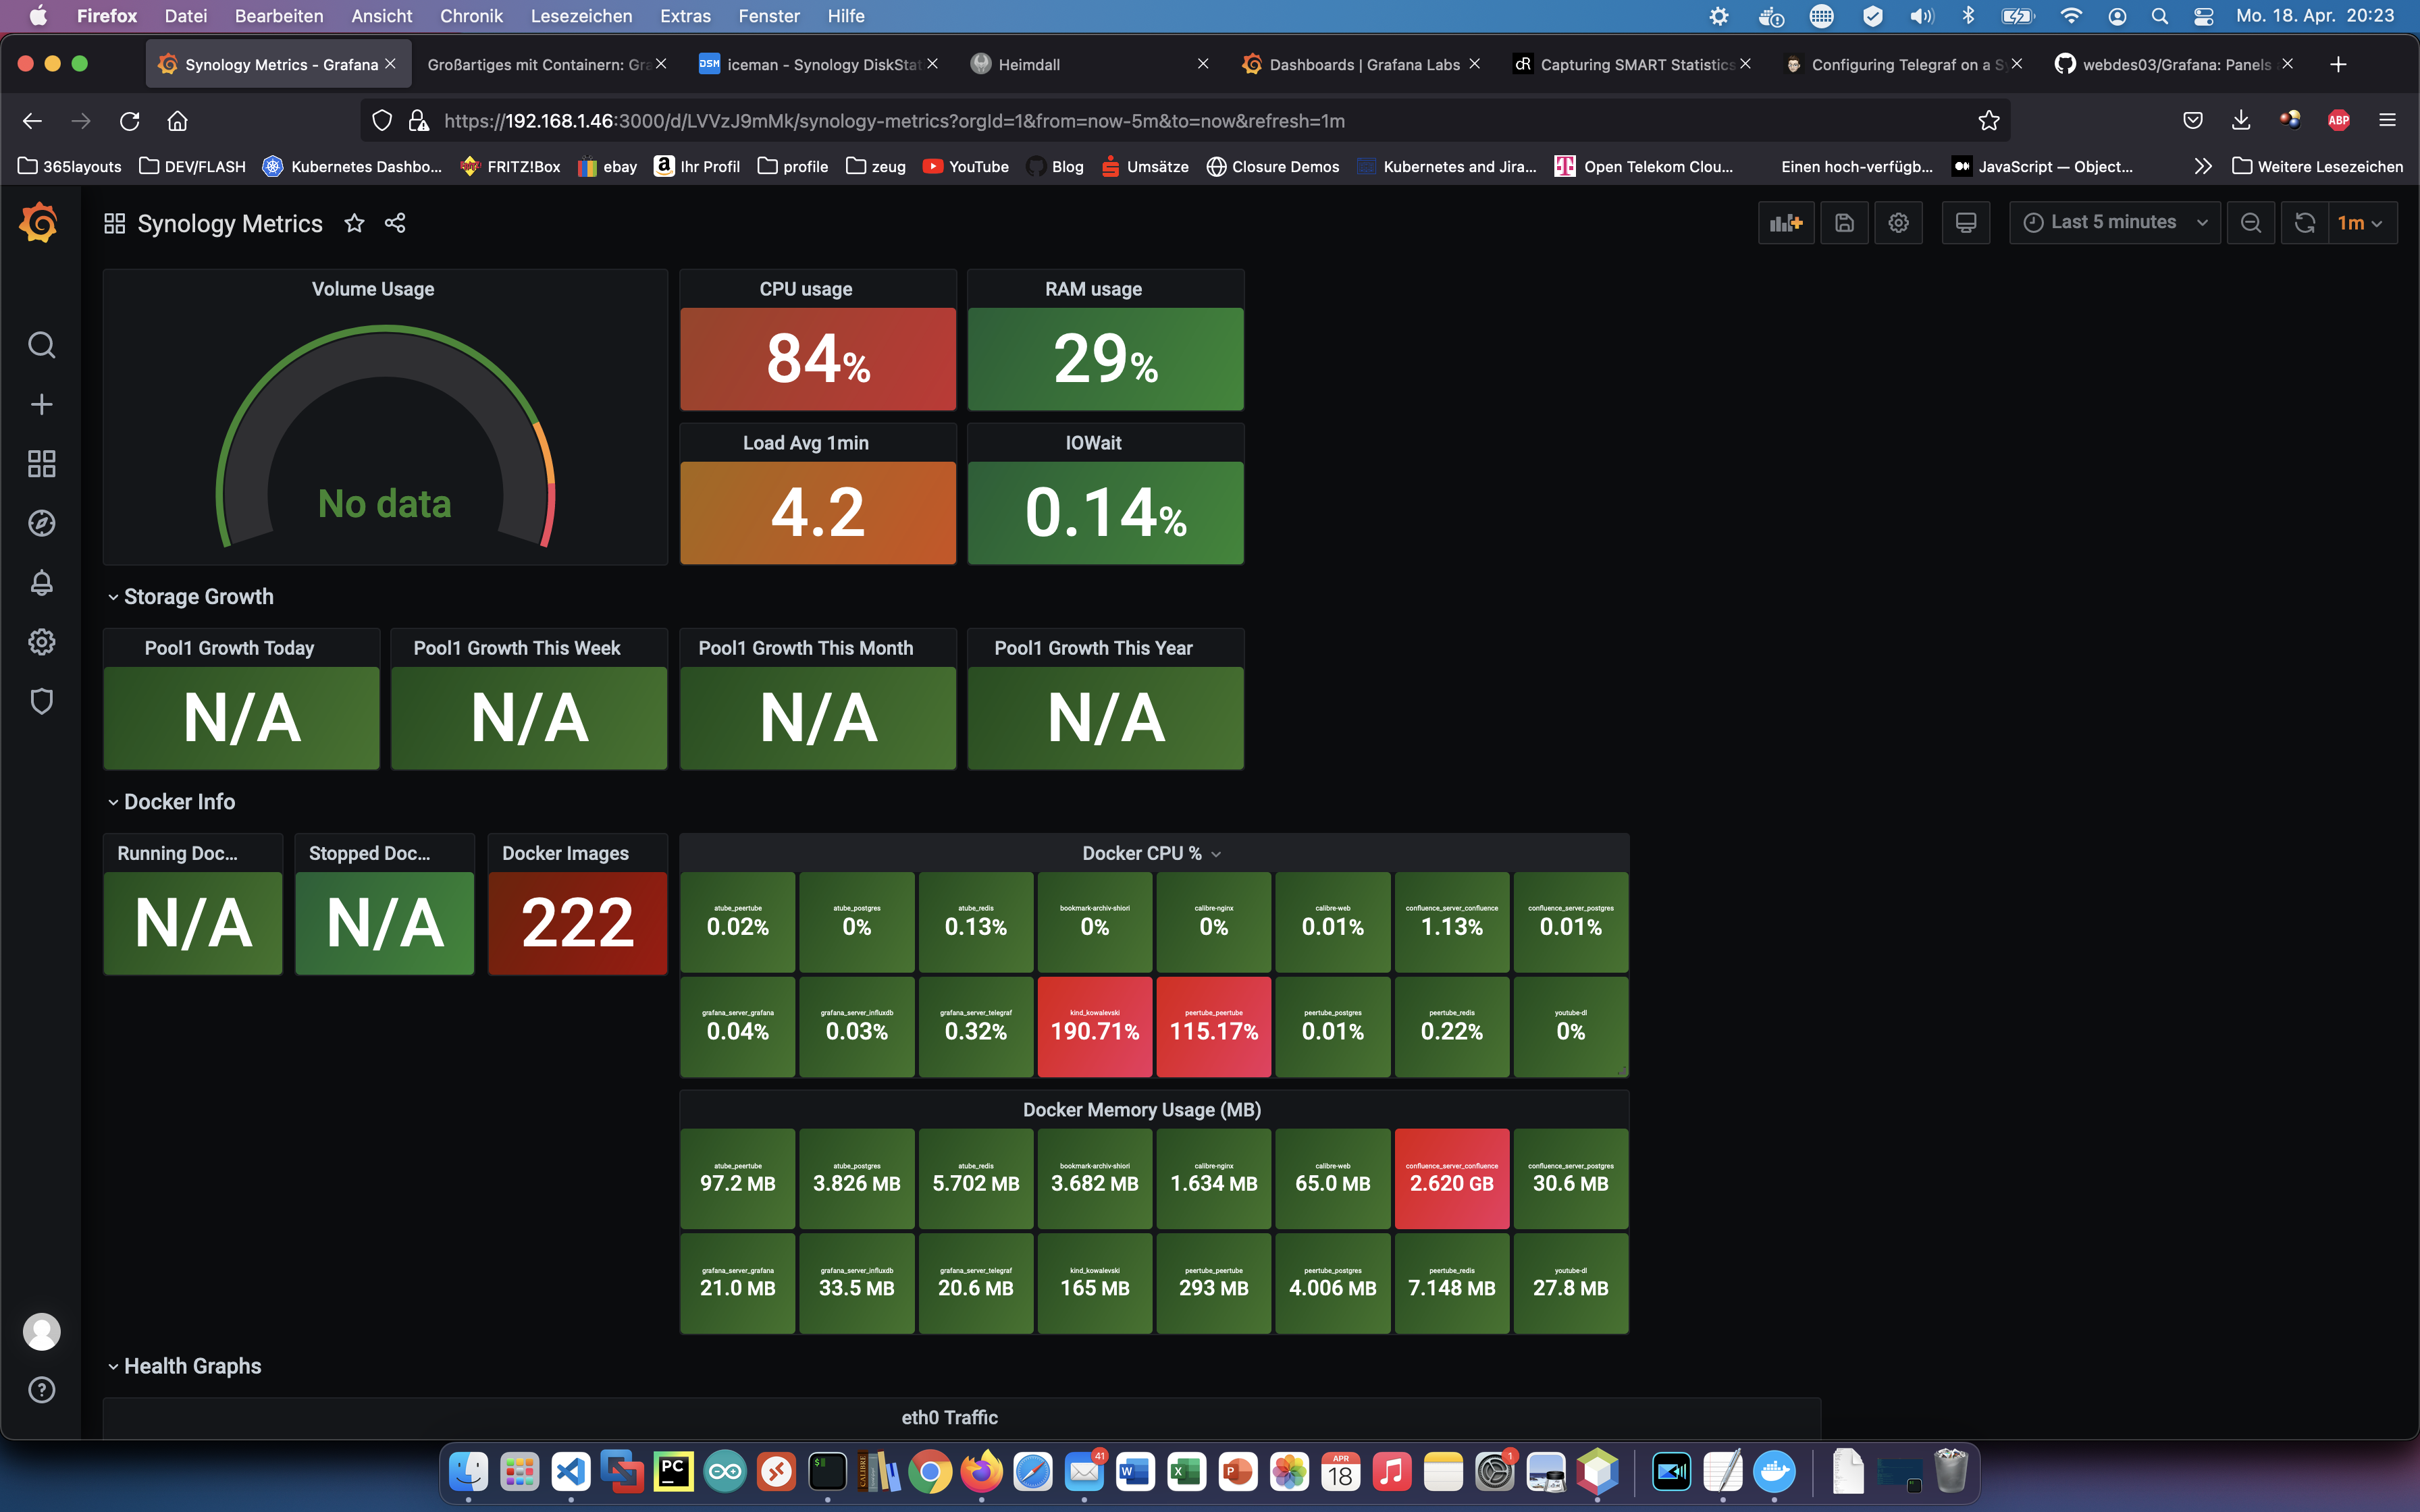
Adım 3: Yapılandırma
Artık sunucuyu çağırabilir, veritabanını yapılandırabilir, gösterge tablosu oluşturabilir ve daha fazla ölçüm verisi bağlayabilirim.